Forbes released its 17th annual Global 2000: The world’s largest public companies list on 16 May. The survey ranks the world’s largest companies and below we take a look at which firms made the top-20 list, which sectors emerged as the winners and how China and the US seem to be battling it out among the top-20 (a complete list of the 2,000 companies can be found here).
Banking and financial firms stood out in the survey especially among the 10 biggest companies. Once again, Industrial and Commercial Bank of China retained the number-one position (for the seventh year running). It is the only firm exceeding the $4trn mark in terms of assets. However, this year, JP Morgan Chase surpassed China Construction Bank to take the second position, thanks to US tax cuts boosting its profit. Fourth place went to Agricultural Bank of China followed by Bank of America (BofA) in fifth spot. Apple was in sixth position, with Ping An Insurance Group, Bank of China, Royal Dutch Shell (Shell) and Wells Fargo accounting for the remainder of the top-10. China’s so-called big-four banks (ICBC, China Construction Bank, Agricultural Bank of China and Bank of China) all made the top-10.
ExxonMobil came in at no. 11, while AT&T was in twelfth spot (it paid c. $104bn for Time Warner last year). They were followed by Samsung, Citigroup, Toyota, Microsoft, Alphabet, Volkswagen, Chevron, and Verizon Communications, which rounded out the 20 largest firms.
Figure 1: The 20 largest global companies according to the Forbes survey:
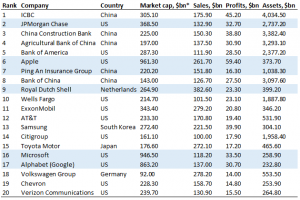
Source: Forbes. *as at 18 April 2019.
Note light blue highlights indicate companies in the Anchor High Street Equity Portfolio
Looking at those companies in Anchor’s High Street Equity Portfolio, Apple was the top performer in terms of profit at $59.4bn, while it also had the highest market cap among the 2,000 companies. Microsoft and Alphabet came second and fourth (with Amazon in between) at respective market caps of $946.5bn and $863.2bn (as at 18 April). Meanwhile, on the back of the US tax cuts (introduced in December 2017), JPMorgan Chase recorded a $3.7bn profit windfall – the second biggest YoY increase in profit on the list. Shell was ninth in terms of profit ($23.3bn), and third in terms of revenue ($382.6bn) as cost savings and a stronger contribution from its crude oil and liquefied natural gas segments buoyed its results. China’s Ping An Insurance Group, a recent addition to the portfolio, was in seventh spot
Those companies in our portfolio which didn’t feature among the top-20, but still made the overall list included Amazon (no. 28), Johnson & Johnson (no. 37), Alibaba (no. 59), Facebook (no. 63), The Walt Disney Co. (no. 70), Unilever (no.106), Prudential (no. 112), Home Depot (no. 126), FedEx (no. 184), Synchrony Financial (no.191), Anglo American (no. 261), Nike (no. 280), PayPal (no. 318), MasterCard (no. 334,) Booking Holdings (no. 370), ICICI Bank of India (no. 400), Yum Brands (no. 949), and Ulta Beauty at 1,144th position. Admiral Group didn’t feature in the Forbes list.
Figure 2: The 10 countries (out of 61) featuring the most companies on the list
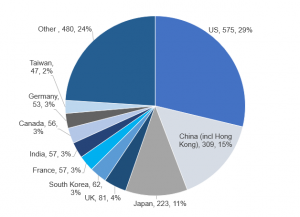
Source: Forbes.
In terms of the 61 countries represented, from which these 2,000 companies come (see Figure 2 above), at 575 the US remains home to the most companies on the list, while 309 are based in China and Hong Kong (vs 291 last year), and 223 come from Japan. In total, the Asia-Pacific region accounted for 40% of the companies on the 2019 list. Amongst the Chinese companies listed, the highest company to debut this year is smartphone manufacturer, Xiaomi at no 426.
In 2003 (the first year Forbes released this list), when the US contributed 776 companies, China and Hong Kong had just 43 companies on the list. In 2019, China accounts for most of the 10 biggest firms as its five entries beat the US’ four. Warren Buffet’s Berkshire Hathaway, for example, fell out of the top-10 rankings for the first time since 2010, and is now in 26th position. This after its balance sheet saw a 4Q18 write-down due to its holding in Kraft Heinz (which dropped by 400 spots to no 548), after it restated $181mn of its financials last year.
By industry, banks & diversified financials accounted for most of the companies on this list at 453, followed by technology counters (154), construction (123), oil & gas (110 – as stronger oil prices over the past 12 months or so saw profits rise in the sector) and insurance (102). Meanwhile, the materials sector contributed 102 companies, while consumer durables stood at 90, business services & supplies at 88, utilities at 84 and food, drink and tobacco at 75 companies represented.
Figure 3: Industries with the largest profit gains, $bn
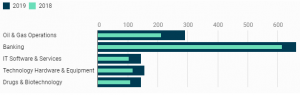
Source: Forbes
In total, the 2019 list of 2,000 companies account for $41.2trn in revenues, $3.4trn in profit, $186.7trn in assets and $56.8bn in market cap.
How does Forbes calculate the rankings?
According to Forbes, the rankings are based on a composite score of revenue (sales), profits, assets and market value, using data from FactSet Research systems (as at 18 April 2019). All figures are consolidated and in US dollars with the latest-12-months’ financial data available used. Forbes writes that it also quality-checks downloaded financial data using other sources, including Bloomberg and available company financial statements. Publicly traded subsidiaries for which the parent company consolidates figures are excluded and, for most countries, the accounting rules for the consolidation of a subsidiary is when the parent’s ownership (control) of the subsidiaries stock is above 50% (some countries’ accounting rules allow for the consolidation of a subsidiary at less than 50% ownership).