Synchrony Financial, the largest private-label, retail credit card business in the US, produced good results for 1Q20. Credit trends were ahead of expectations (write-offs at 5.36% were below last year’s level) and purchase volumes rose 6% YoY (excluding the sale of the Walmart book from the prior year). But all this is history and less relevant right now. Credit provisions increased sharply in 1Q20, in-line with the new current expected credit losses (CECL) regulation as well as the worsening outlook for the US economy, resulting in a 71% YoY decline in diluted EPS to $0.45.
Like JP Morgan, Synchrony began to see a change in consumer trends in the second half of March, and this deteriorated further into April. Purchase volumes declined significantly – down 26% for the second half of March, and down 30%-35% in the first half of April. We note that the decline has now stabilised at this level.
At the end of 1Q20, management were assuming that the US unemployment rate would rise to 10% in 2Q20 (with hindsight this is too low) and then gradually improve over the balance of 2020 and into 2021. Fiscal stimulus measures from the US Treasury could shift the spike in write-offs to 3Q20, followed by a gradual decline in 2021.
What about the valuation?
Tangible book value (TBV) per share is $15.35. The share trades at 1.05x tangible book. The historic PE is 3.8x and the forward PE (to FY20) is c. 8x – after a 50% YoY decline in EPS in FY20. Thereafter, we would expect a sharp recovery in earnings. In normal credit conditions, the return on tangible common equity (ROTCE) is closer to 30%, far higher than the larger banks. Synchrony achieved a ROTCE of 11.6% in 1Q20. We could justify a price/TBV of 2.3x, which implies a share price of >$30 (currently it is at around $16.50/share).
Why do we still like Synchrony?
We like the Group’s market-leading position in private-label, retail credit cards. Although earnings are more volatile than in other sectors of the market, we prefer the very high risk-adjusted yield in the private-label credit card market (see below) – which leads to a very high ROTCE over a normalised cycle. This ratio will be depressed in 2020 but we believe that it will recover into 2021. The market should regain confidence in the strength of the business once the COVID-19 crisis has passed. Lastly, we like the management team and the way they have run the business since its split from General Electric (GE) in 2015 and the conservative way in which they have entered this year.
Figure 1: Synchrony net charge-off ratio
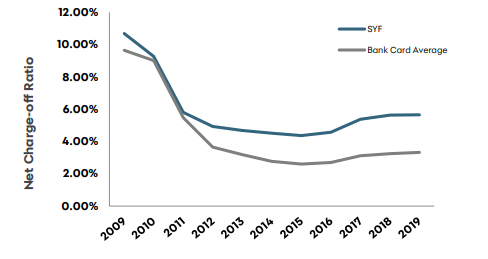
Source: Synchrony Financial
Figure 2: Synchrony financial risk-adjusted yield
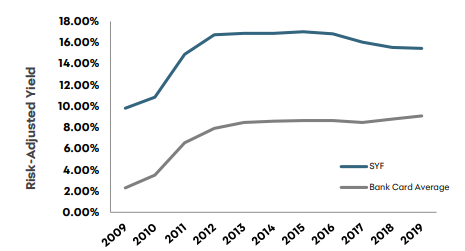
Source: Synchrony Financial
Figure 3: Synchrony earnings forecast, $
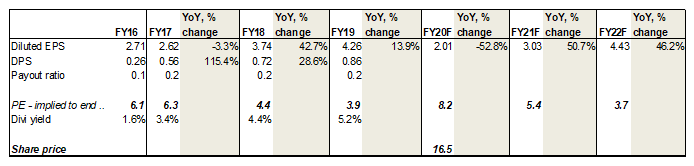
Source: Anchor, Bloomberg, Company data.
Some other detail on Synchrony:
Does Synchrony have enough provisions?
In 1Q20, the income statement reflected provision expenses rising by $818mn to $1.7bn. The balance sheet has total credit provisions of $9.2bn, or 11.1% of period-end loan receivables.
In recent years, write-offs have been in the range of 4.36% (2015) of average loan receivables (below the long-term averages), to a more normal 5.65% (2019). The US consumer has been behaving responsibly and has maintained a reasonable personal savings rate. We note that during the global financial crisis (GFC), write-offs rose to 11.26% (2009). This is in-line with what Synchrony currently has in its provisions (11.1% of receivables).
In 2Q20, write-offs will rise. Additional provisions will also be raised. We highlight that loan receivables will no doubt decline in 2Q20 (as customers spend less and continue to pay down loans), which means that credit provisions as a percentage of loan receivables will probably increase by default above the current 11.1% level.
How has Synchrony’s customer base changed since the GFC?
Synchrony has a better customer base now compared with 2008 as can be seen in the charts below (Figure 4), where its FICO score (the US credit-scoring system) has moved up materially since 2008. This shift would also have been helped by the loss of the Walmart credit card contract. What this means is that its customer base should be more resilient in the current downturn but, as Figure 4 also shows, 27% of its loans (i.e. 9%+18%) are to customers with a FICO score below 660 – i.e. sub-prime. Synchrony’s customer base may have improved but it still carries plenty of credit risk.
We also note that 41% of its customer transactions were digital – this share of sales has risen steadily over time.
We will also have to watch out for JC Penney – a retail partner which is in trouble. If this business folds, Synchrony will try to convert its customer base to the Synchrony general purpose credit card. Customers, however, will still have to settle their accounts.
Figure 4: Focus on a higher-quality asset base
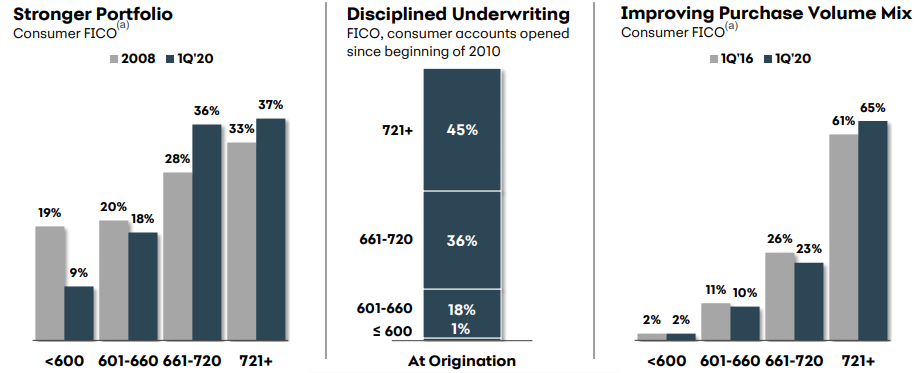
Source: Synchrony Financial
How strong is the balance sheet?
When Synchrony split from GE in 2015, it was overcapitalised relative to its peers in the credit card sector. By its own admission Synchrony is still overcapitalised and expects to move in-line with peers in the coming years. Synchrony’s CET1 ratio is 14.3%, higher than its peers in the industry (e.g. Capital One is 12.2%). The balance sheet also has excess liquidity post the sale of the Walmart book.