Moving into the last quarter of 2020, we continue to live with the uncertainty brought about by the global COVID-19 pandemic. Global output collapsed in 1H20 as pandemic took hold, with declines of more than one-fifth in some advanced and emerging market (EM) economies. On the positive side, the prompt and unprecedented level of fiscal and monetary support provided by authorities across the globe assisted in curtailing what would have been a substantially larger contraction. Economic output has since picked up swiftly, following the easing of lockdown measures and the reopening of most businesses. However, the pace of the global recovery has lost some momentum in recent weeks, amid concerns over the rising ‘second-wave’ of COVID-19 cases across Europe and some US states. Naturally, the renewed virus containment measures in response to these rising cases are fuelling concerns that, after an initial bounce in 3Q20, the pace of a global GDP recovery from the strict 2Q20 lockdowns will be constrained. Consequently, the global economic outlook moving into the last quarter of the year remains clouded and is subject to considerable uncertainty and projections around the trajectory of the COVID-19 virus and policy developments.
As it stands, global household spending on many durable goods has bounced back relatively quickly, but spending on services, particularly those requiring proximity between workers and consumers, or international travel remains subdued. Whilst working hours have fallen significantly across the globe, government support schemes have helped to maintain household incomes. Nonetheless, corporate investment and international trade remains weak, holding back the pick-up in manufacturing production in many export-orientated economies. Overall, in most economies the level of output at the end of 2021 is projected to remain below its level at the end of 2019, and it will also be considerably weaker than projected prior to the pandemic, highlighting the risk of long-lasting effects from the virus. Going forward, fiscal, monetary, and structural support policies need to be maintained to preserve investor confidence and limit uncertainty but must also evolve with both local and global underlying economic conditions.
On the domestic front, it will be a slow road to recovery for SA. Reported new infections have fallen sharply as we move into 4Q20, with recoveries improving strongly. However, there is still considerable uncertainty about how the pandemic will evolve with the human and economic costs of COVID-19 remaining a problem for some time to come. Whilst we note the positive direction which the ruling party is taking in clamping down on corruption, one cannot disregard the prevailing economic situation in the country – sharply brought into contrast by the recent employment figures which showed that 2.2mn jobs were lost in 2Q20 (representing c. 14% of all jobs at the start of the quarter). Sadly, two out of every three people of working age in SA are now unemployed. Given the inherent uncertainty and the magnitude of the policy challenges created by the COVID-19 crisis, the economic outlook on the domestic front remains clouded. Still, with appropriate reforms to lower the cost of doing business and lift investor confidence, we believe that the potential for medium-term growth both domestically and offshore remains. Nevertheless, much like what was experienced in 3Q20, whilst opportunities continue to exist throughout most asset classes, volatility is likely to remain high for the foreseeable future.
SA Equity
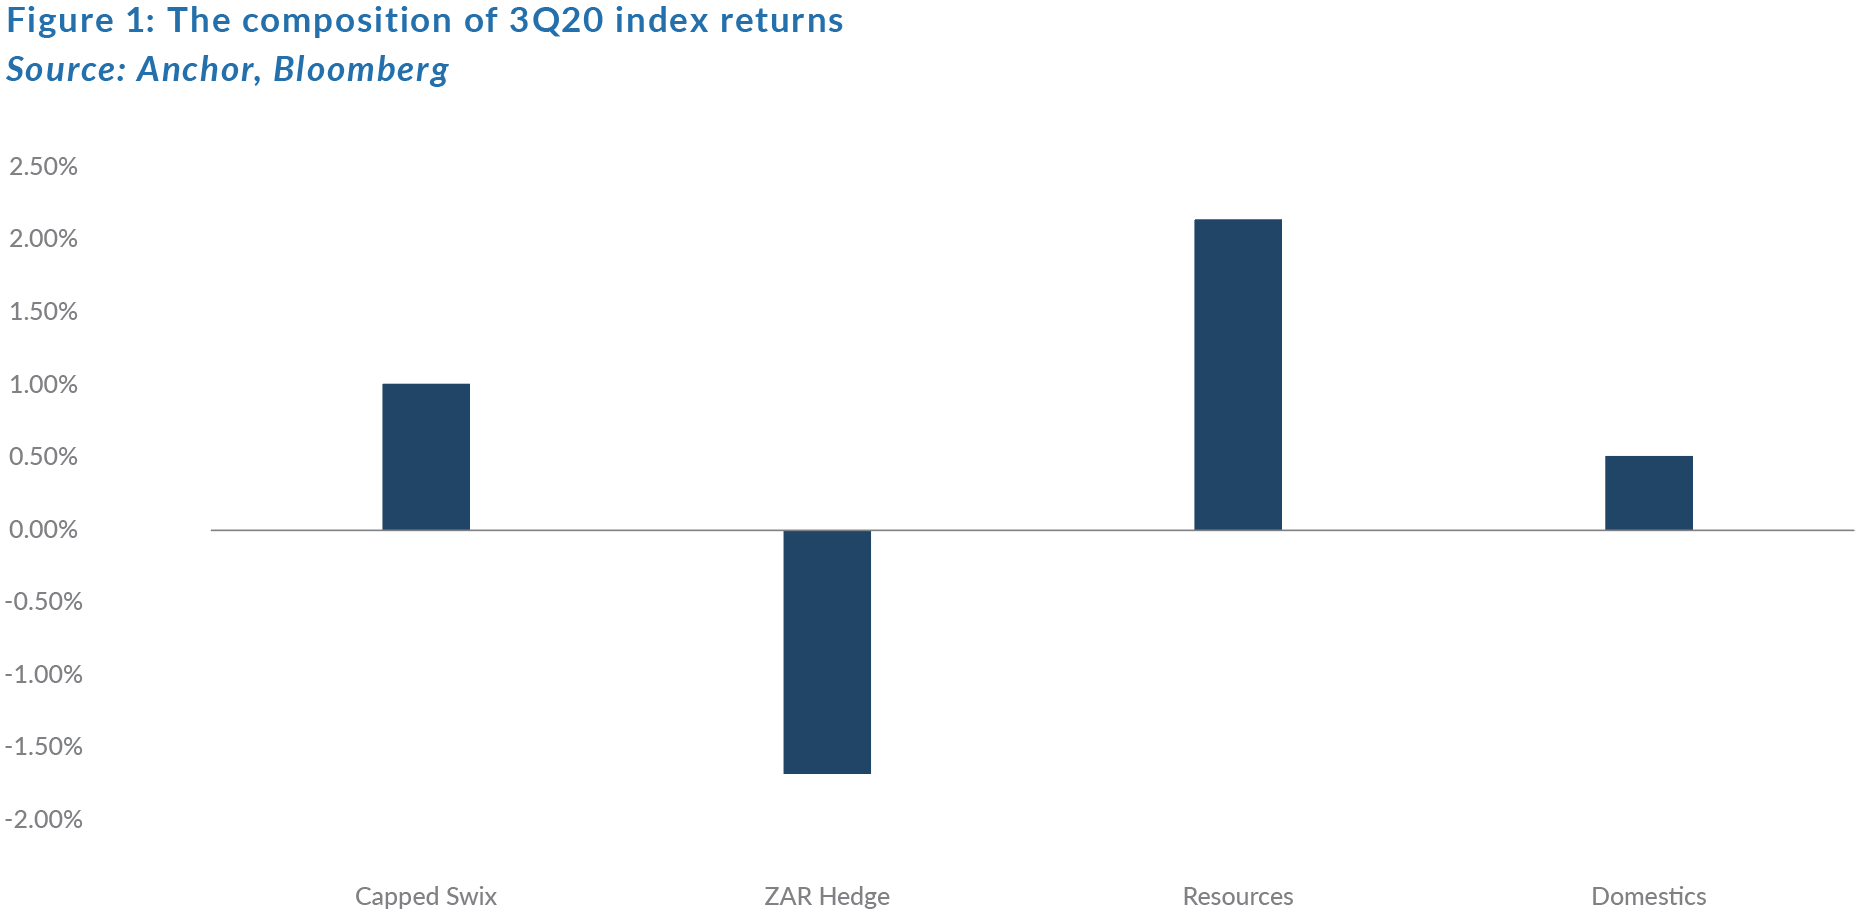
The SA equity market gained 1.02% in 3Q20, managing to avoid a double-digit YTD drop (-9.8%). After the extreme moves experienced by equity investors in 1H20, 3Q20’s 1% return appears, on the face of it, quite ordinary. However, as one further interrogates the numbers, the various silos of the market experienced different fortunes with continued volatility and forecast uncertainty resulting in wild swings of sentiment across different sectors of the equity market.
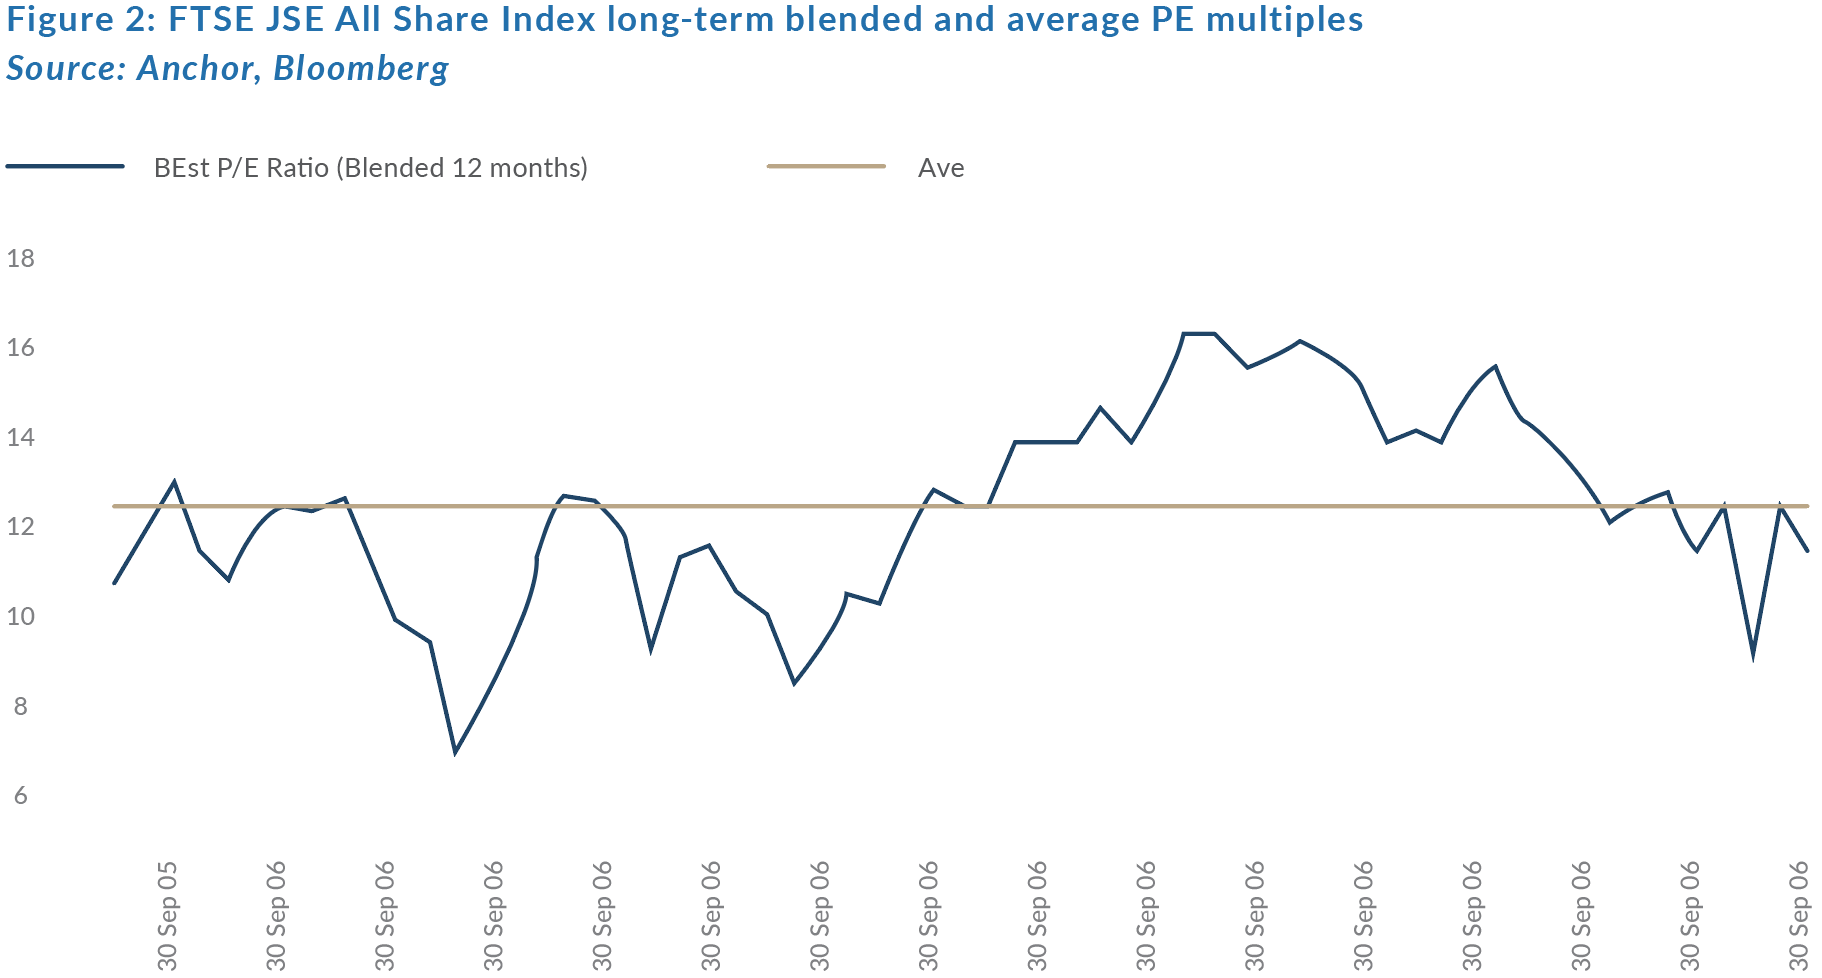
At an aggregate level, the JSE is trading slightly below its longer-term average PE multiple of 12.4x, which intuitively does not surprise us especially considering just how much of the local index is now made up of the basic materials sector. This sector tends to trade at lower multiples during periods of margin expansion, such as the conditions we are currently experiencing.
Those companies reliant on the domestic economy for growth spent most of 2Q20 underperforming the broader index. However, 3Q20 saw a reversal of that trend, as SA gradually emerged from the lockdown and investors were able to assess and quantify just how bad the economic drawdown has been. The return to some semblance of visibility around the operational impact of the pandemic on domestically focussed companies has resulted in what appears to be an operational trough in SA, with a number of catalysts on the horizon to potentially kickstart some incremental positive momentum. We remain underweight the complex, however, as a process we have become incrementally more constructive as business conditions look to normalise and our confidence grows that we are near a trough in terms of company earnings. Unfortunately, we still lack conviction in a more structural domestic earnings recovery (more on this below).
Within the JSE’s basic materials sectors, we highlight that the recent strong performance from SA’s main export commodities (iron ore, platinum group metals [PGMs], and gold) has seen continuous positive earnings momentum, resulting in the sector accounting for close to 30% of the FTSE/JSE Capped Swix Index – up from around 20% a year ago. As an investment house, Anchor has a clear bias towards higher-quality, less-cyclical businesses, and the 30% weighting in the index makes for some discomfort when considering the volatility of returns we have come to expect from this sector. However, factoring in the optically cheap multiples at which materials companies are currently trading (more in the section on resources below) and demand side factors for those commodities seemingly remaining supportive in the current environment, we have decided that there is enough margin of safety priced in at current levels to warrant our moderate exposure to the sector.
The group of companies with business practices largely outside of SA do not have a particular golden thread that links their fortunes and, as a complex, most experienced a very strong rebound in 2Q20, with the recovery in the rand exchange rate against most global currencies merely holding onto hard currency gains which saw the aggregate contribution to the index return as negative. Large index components such as Naspers ended the third quarter 6% QoQ lower, once again underperforming its underlying investment in Prosus by 2%, and its look-through investment in Tencent by 6%. The reorganisation of Naspers’ corporate structure a year ago can now be seen as value destructive for shareholders who have seen the discount widening instead of narrowing. This was despite the key verticals of Naspers/Prosus (outside of Tencent) being well placed to take advantage of the structural shift to living life online, whether it be ecommerce, food delivery or payments, all three of these key verticals have seen an acceleration in consumer adoption, yet have seen the value placed on it by JSE investors impaired significantly. Unfortunately, the Naspers corporate structure will likely remain a drag for shareholders in the short term, although we are confident that plans are in place to ensure a narrowing of the stubbornly high discount to NAV at which Naspers is currently trading and, as such, we remain fully invested in both Naspers and Prosus.
Resources Sector
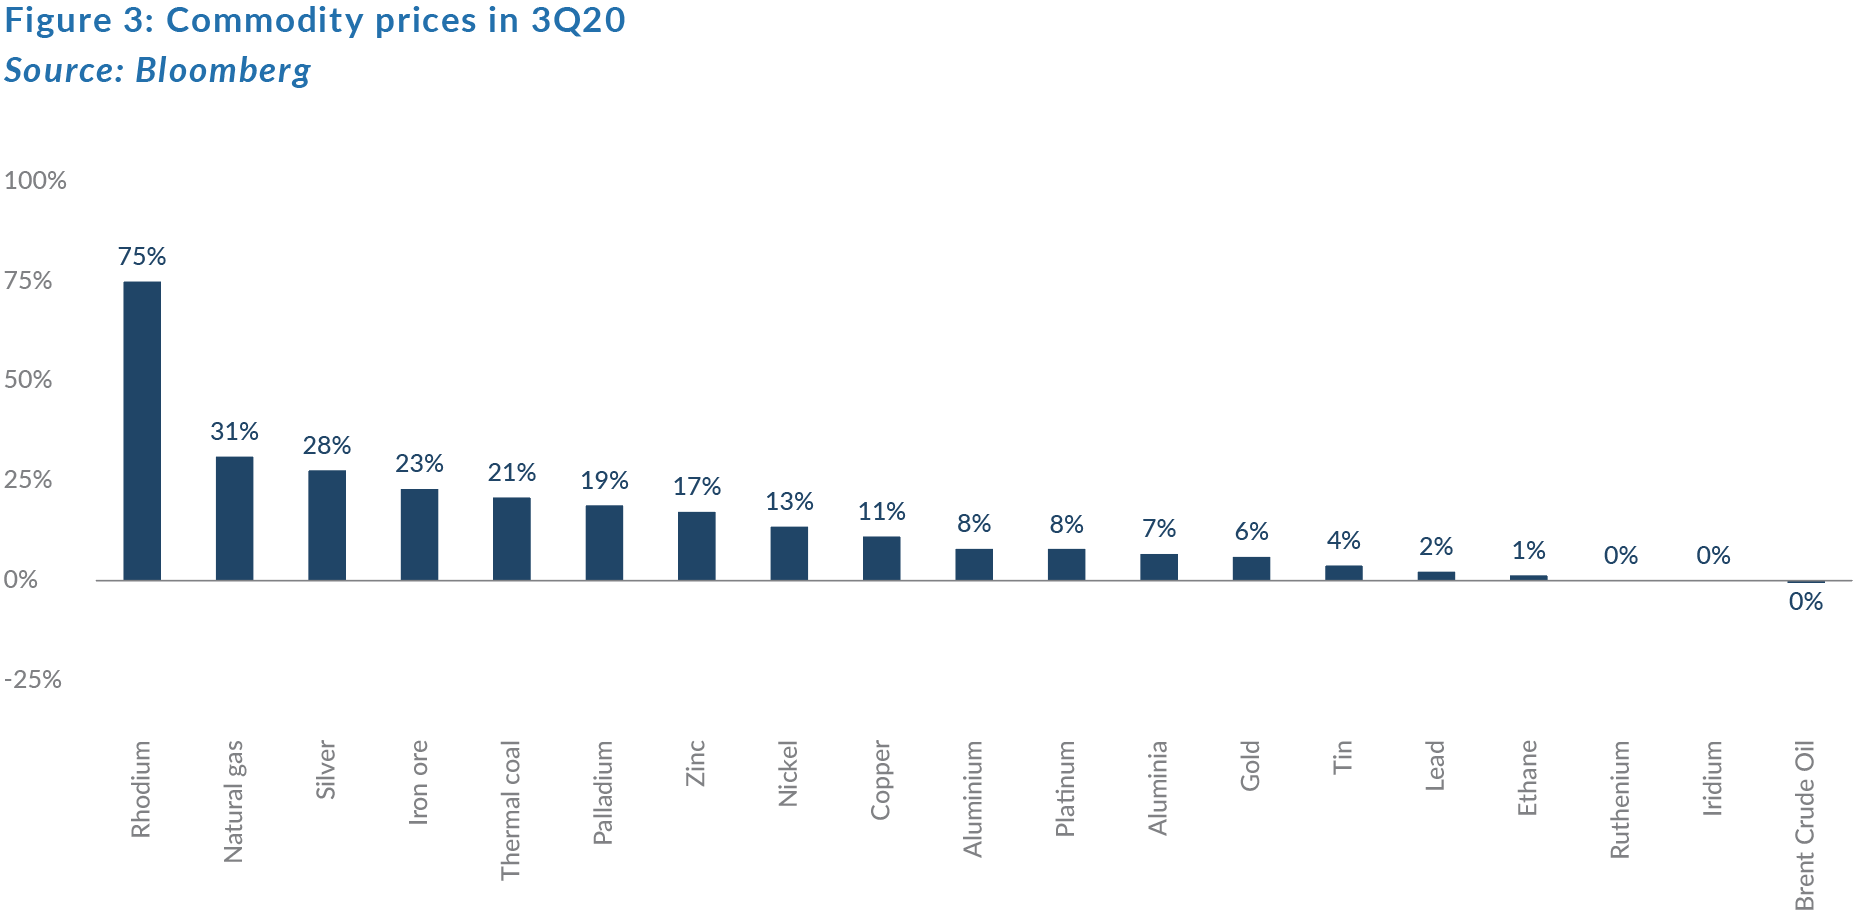
The third quarter was another strong period for the resources sector as the recent momentum in precious metals and iron ore prices continued. The prices of rhodium, silver, iron ore, and palladium ended the quarter 75%, 28%, 23%, and 19% higher QoQ, respectively (see Figure 3). Share prices followed suit. The PGMs and gold were the strongest sub-sectors. With the exception of Anglo American Platinum, which had unique volume challenges this year, the major PGM miners such as Northam Platinum, Impala Platinum, and Sibanye-Stillwater were up 47%, 25%, and 23% QoQ, respectively. Similarly, in the gold sector, share prices rose over 20%, except for AngloGold Ashanti. Precious metals miners have substantial operating leverage. These businesses can experience significant changes in earnings expectations from relatively minor changes in the underlying commodity prices. Diversified miners with no exposure to precious metals or iron ore, such as Glencore and South32, continued to show a muted performance in 3Q20. Paper and packaging companies, Sappi, and Mondi, lagged the wider sector as pulp and packaging prices remain muted.
We continue to expect that the resources sector will have its strongest earnings growth in the precious metals complex, thanks to the PGM basket price nearly doubling and the gold price jumping 47% YTD in rand terms. For diversified miners, we expect firms with exposure to precious metals and iron ore to grow their earnings faster than those without that exposure. Diversified miners that rely predominantly on base metals are expected to continue having muted earnings growth.
Commodity supply and global growth remain key risk factors for the sector. As COVID-19 lockdowns start to lift around the world, supply for key commodities like iron ore and palladium are expected to begin to normalise. Prices of these commodities have been helped by weaker-than-expected supply, in large part thanks to COVID-19 production shutdowns. In 4Q20, iron ore output out of Brazil may start to normalise as Vale tries to ramp production back up. The local PGM sector will also approach full capacity over the course of 4Q20, following the sharp decline in YTD supply. Disruptions to these supply recoveries would be positive for the sector, in addition to the much-discussed potential V-shaped recovery. Conversely, poor global growth and a strong rebound in supply would be highly bearish.
SA Domestic Equity
The road to recovery for the SA economy is going to be long and filled with potential pitfalls. The past decade has seen SA experience a decline in its GDP per capita and rampant corruption has hollowed out business and consumer confidence. Foreign investors have, to a large extent, lost interest in the SA economy and the fiscal position of government is precarious at best. This is a tough position from which to start a recovery journey. However, recently the SA government has started to move in the right directions. Corrupt government officials and businessmen are being arrested, the Independent Communications Authority of SA (ICASA) has finally released the terms for the spectrum auction, and the Minister of Mineral Resources and Energy has gazetted laws that will govern the next round of the 11,813 MW bid window for renewable energy. The lack of urgency from government has been exasperating, but at least the gears are starting to turn and hopefully SA’s journey to recovery has begun.
The domestic equity market has largely missed out on the global recovery. From a low of 42% down on 23 March, SA Inc. has recovered but remains approximately 30% lower YTD. The valuation rating of SA Inc. is at all-time lows relative to our EM peers and global markets overall. These low valuation multiples allow us to argue that, although structural earnings growth will remain elusive while the energy crisis in SA is ongoing, some quality domestic companies are offering value.
We continue to view domestic equities as tactical short-term trading opportunities rather than longer-term structural growth stories. But we do believe that there are some interesting opportunities rearing their heads locally and we will look to take advantage of what we consider to be long-term, structural growth stories while also remaining very conscious of the risks associated with SA equities.
With the core of our portfolios having a more longer-term approach, we remain very defensively positioned towards domestically focussed companies. As a complex we remain underweight, however there appears to be many company specific opportunities on which we are building conviction. To mention one, the accommodative monetary conditions (record low interest rates), if matched by a stabilisation of the unemployment crisis could reignite a material pickup in consumer spending, making our retailers well placed for a cyclical rebound.
Incorporating all of the above, our twelve-month total return projection for the JSE, using our bottom-up models, is 11.3%. However, we highlight that this bottom-up approach incorporates hundreds of variables, some of which are very difficult to forecast with any degree of certainty. The most important factors that will likely drive returns will be the global monetary and rates environment, and whether SA is able to implement much-needed policy reform and win the benefit of the doubt from foreign investors once again.
SA Property
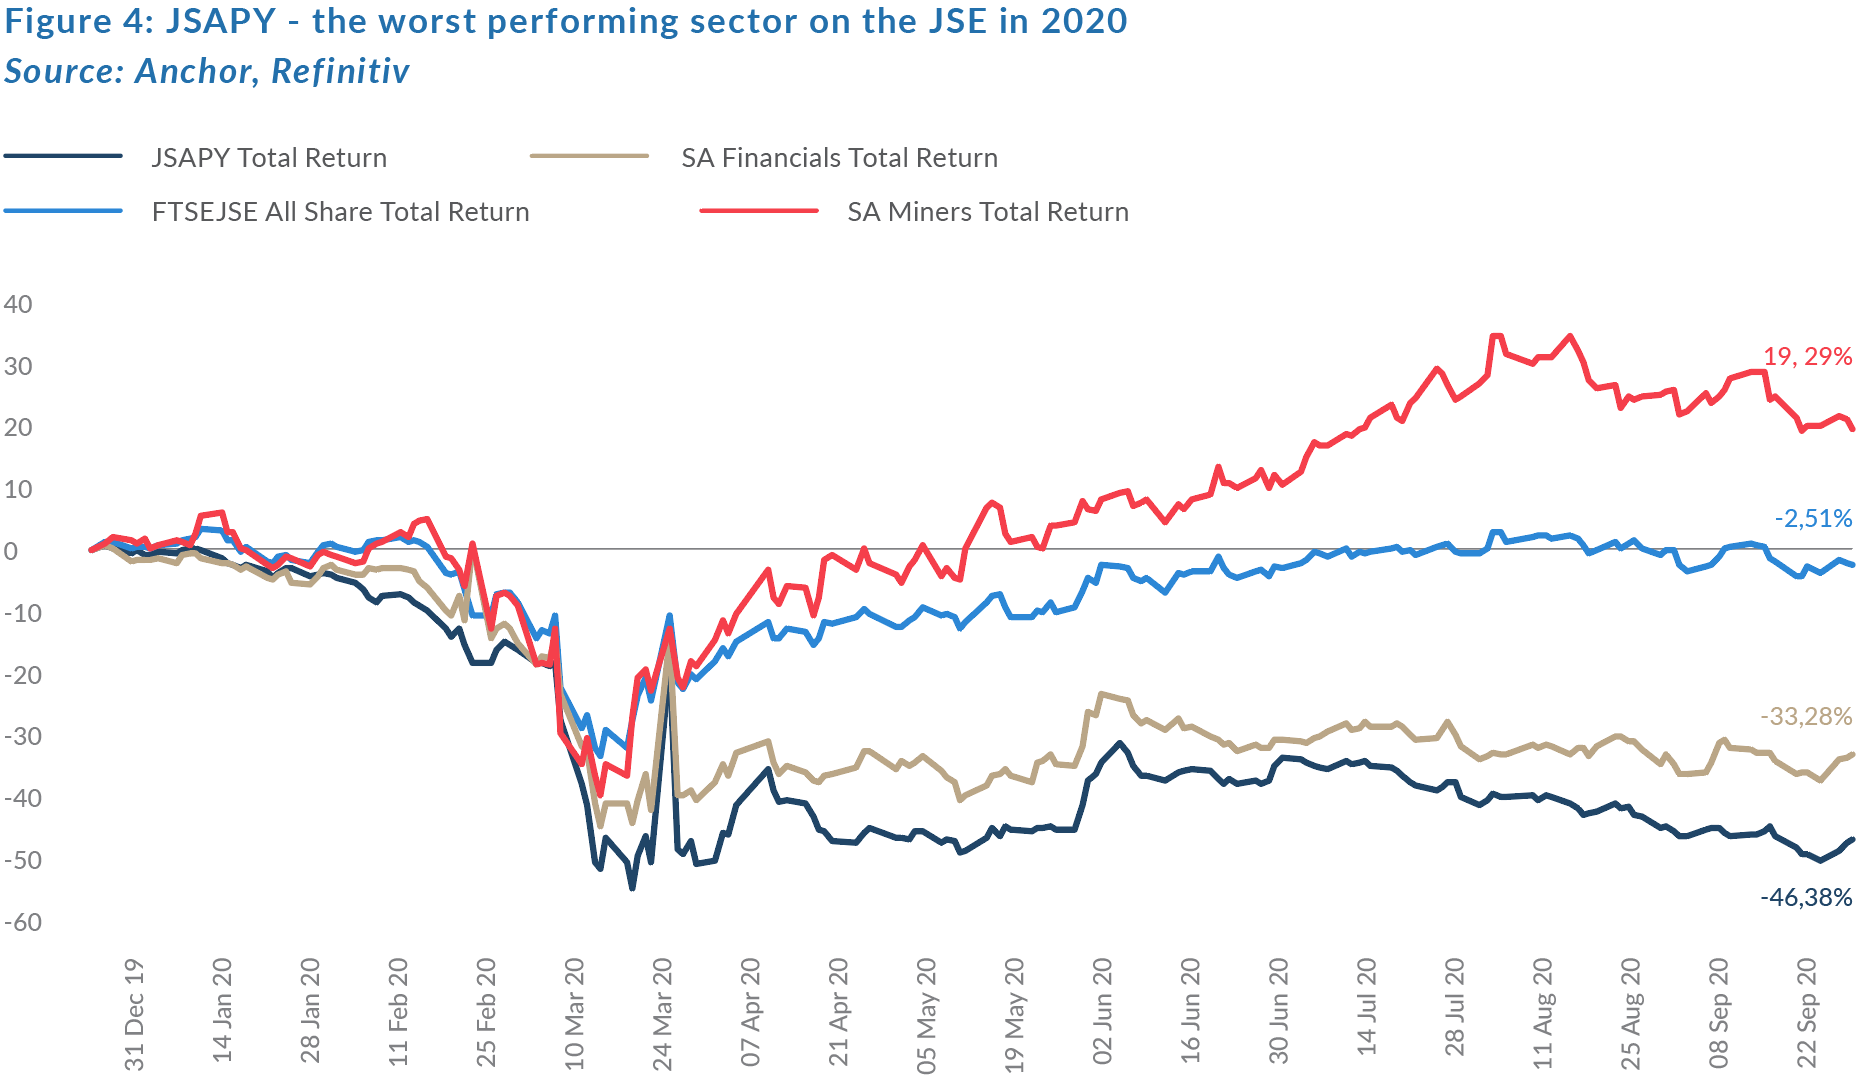
The SA listed property sector has continued to underperform the overall local market and has emerged as the asset class hardest hit by the COVID-19 pandemic. The SA Listed Property Index (JSAPY) fell by 3% MoM in September, by 14% in 3Q20, and is down 46.4% YTD. Figure 4 below shows the YTD performance of the JSAPY vs major SA equity indices including the FTSE JSE All Share Index.
The local property sector is now in unchartered territory as real asset valuations (shopping centres, offices, industrial sites etc.) fall and the incomes being generated by these assets decline as consumers shop online and people work from home. The pandemic has, virtually overnight, changed the nature of the relationship between landlord and tenant from a contractual one to a commercial one that requires an understanding of, and a reaction to, client conditions. As these factors deteriorate to this point due to the countrywide and global lockdowns, the painful impact on property owners must be shared with tenants to avoid systemic carnage across most sectors of the economy.
For equity property investors this has two main focal points, i) dividends and share prices that reflect this income stream as well as ii) valuations attributed to the physical assets.
Dividends
Most of SA’s listed property companies are real estate investment trusts (REITs). REITs are effectively allowed to operate on a tax-neutral basis, which means that distributable earnings are not subject to tax at the company level and flow straight through to the investor, who then pays income tax on the amount paid out. This applies if at least 75% of distributable earnings are paid out on this basis – a requirement for a company to retain its REIT status. Severe constraints on rental collections, caused by the pandemic, has meant that net property income (NPI) has fallen. Management therefore needs to allocate lower earnings to various stakeholders, including servicing debt funders.
It was recently reported that the JSE, which governs listing requirements, may have given a special dispensation to REITs to not pay dividends for a period of time in order to retain earnings, pay-down debt, and strengthen their balance sheets during this difficult period. However, this is not the case, instead what has been agreed upon is a six-month window post financial year-end for REITs to pay their regulated amount of distributable earnings – effectively a two-month extension on the normal rules.
Valuations
Whilst the JSE ruling may seems beneficial for investors at first glance, it does shine a spotlight on those REITs with high loan-to-value (LTV) ratios. Because physical property assets are not liquid, sales to pay-down debt take time. When there is some distress in markets, this time lag is exacerbated. Listed shares have therefore come down to price levels which appear great value based on published net asset values (NAVs). However, in reality, this is the anticipation in advance of property values falling, owing to earnings declines and the lag in valuators reacting to these circumstances.
Long-term investors can take comfort in the fact that fundamentals will return to the sector, and these will govern the returns produced. Still, the current environment makes forecasts difficult and also means that there are a wide range of outcomes possible, due to the following:
- Payout ratios will differ from company to company (and some may not pay out dividends, either giving up their REIT status or citing liquidity constraints).
- The revenue model of some property segments may change (i.e. retail rentals may move towards a more turnover-based formulae).
- Valuations may be under pressure for some time due to the lag effect.
Our bull-, base- and bear-case 12M returns in the sector, using a methodology of equally weighting returns, based on (1) forecast yields; and (2) price/NAVs is presented below.
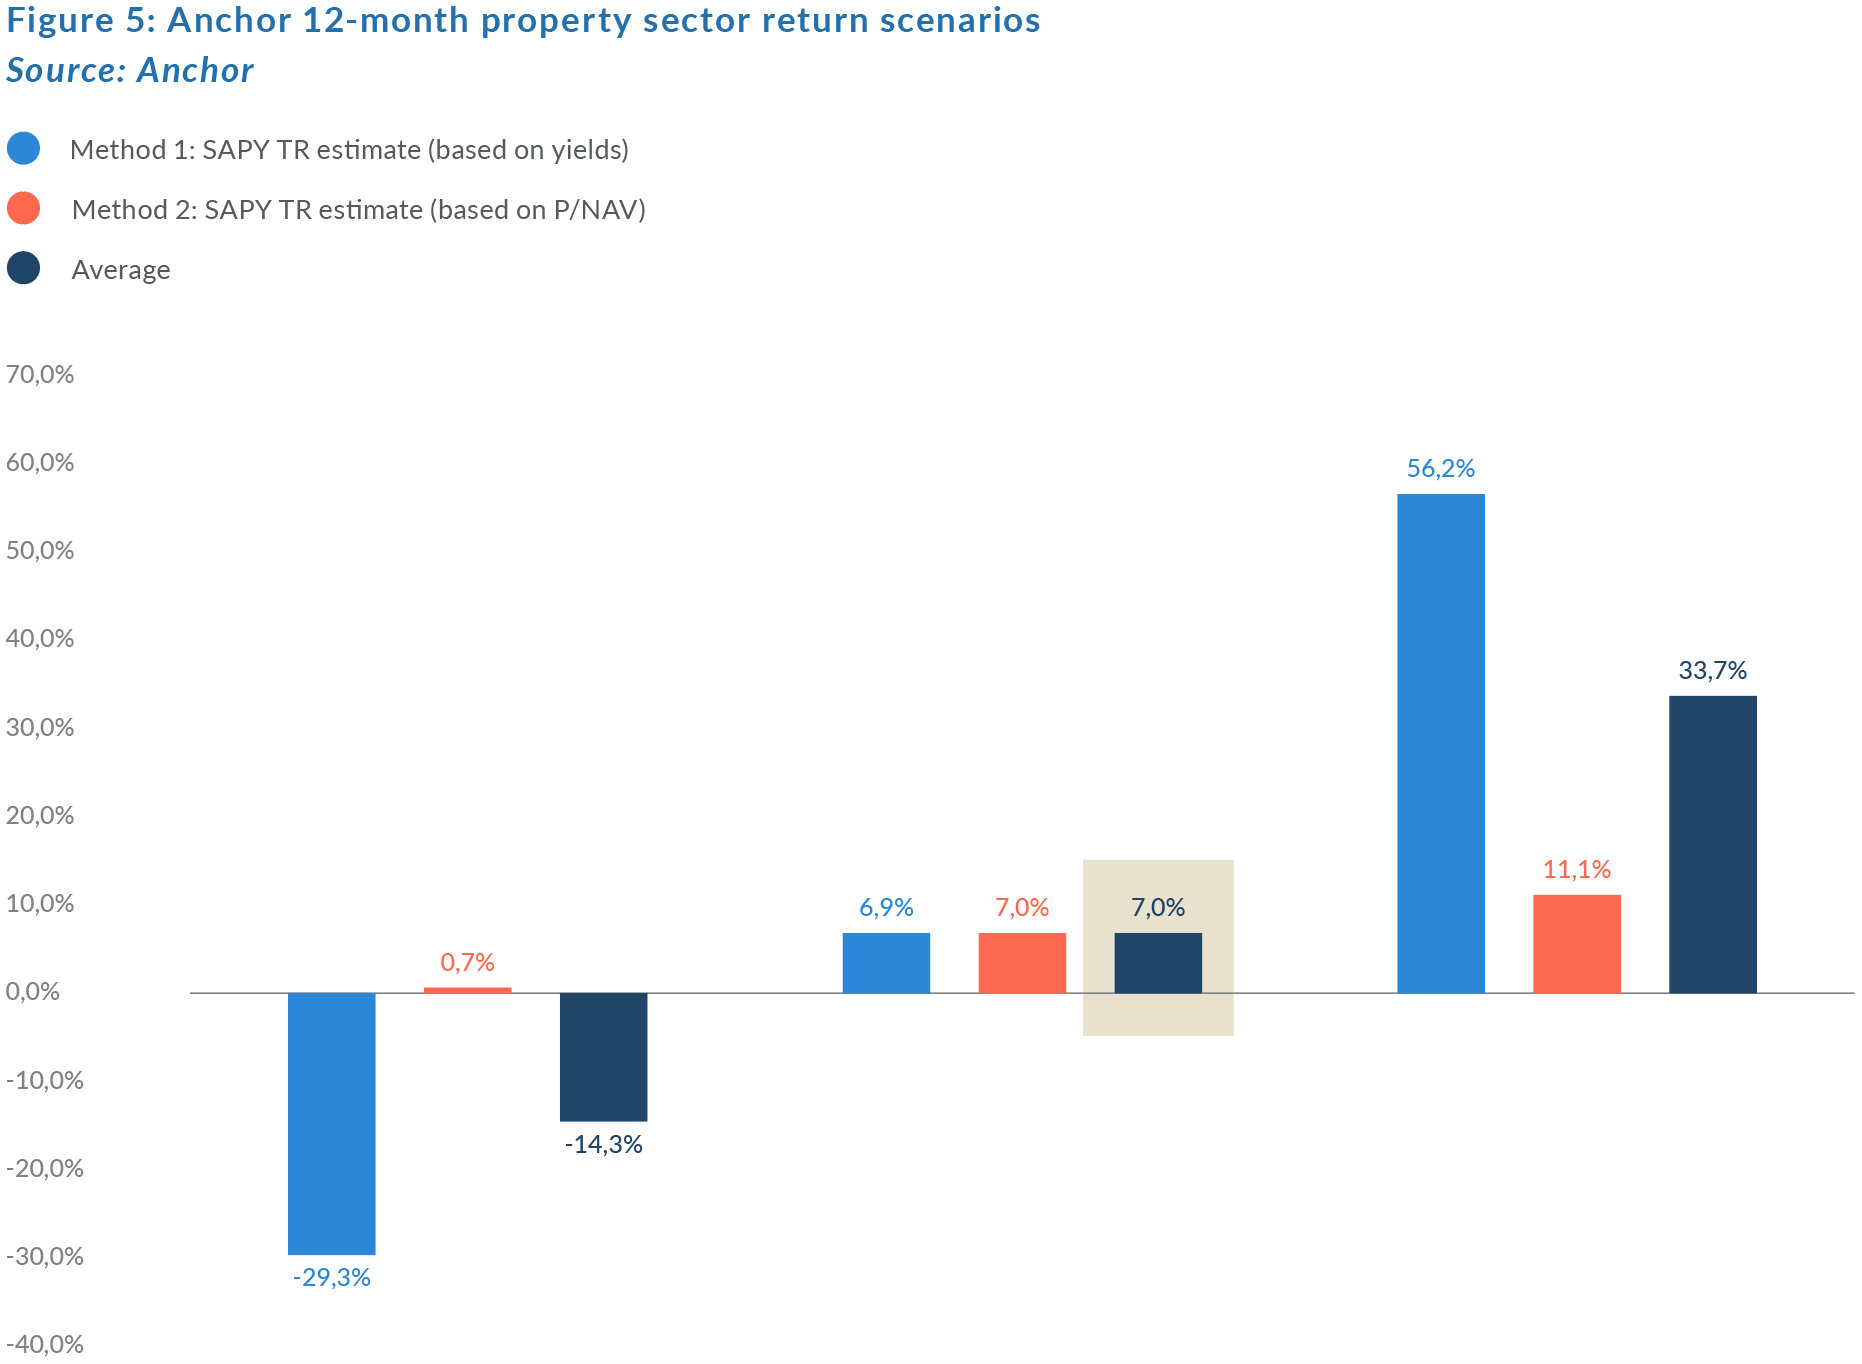
Our base-case, 12-month return forecast is currently 7%, with the caveat being that the sector will remain extremely volatile.
SA Bonds
2020 has proven to be a dramatic year, with all asset classes impacted by the spread of the COVID-19 pandemic. Local fixed-income investments have been no different. In the previous edition of The Navigator – Anchor’s Strategy and Asset Allocation, 3Q20, the impact of the pandemic was still in its infancy. We now have reliable indicators that show the extent of the economic damage (for example the large increase in SA unemployment as over 2.2mn job seekers exited the market), as well as some evidence around the SA government’s monetary response to the virus. The fiscal impacts thereof will become clearer in the coming months – with the medium-term budget policy statement (MTBPS) to be presented by Finance Minister Tito Mboweni at the end of October.
SA bonds sold of dramatically in March and into April. However, 3Q20 proved to be far more muted. Bonds remained range-bound, with the R186 trading at between 7.13% and 7.91% for the quarter. Currently, the R186 trades at 7.2% and the R2030 at 9.4%. The domestic bond curve remains steep, with a large increase in yield pickup for term between the 5-year point and the 20-year point (the spread between the R2040, maturing in 2040, and the R186, maturing in 2026, is currently at 4.5%).
This bifurcation is being driven by two issues:
- Rate cuts from the SA Reserve Bank (SARB) driving the short end of the curve down.
- A lack of confidence in SA’s longer-term fiscal outlook.
Since January 2020, the repo rate has come down from 6.5% to 3.5%, this rate cutting cycle has aggressively brought the short end of the curve down. Added to this, SA’s fiscal position is now weaker than it has been in decades. With debt to GDP projected to reach over 80% by the end of 2020.
Anchor’s position remains cautiously optimistic – duration assets remain attractive both from a yield and a capital appreciation perspective, particularly considering the repo rate cuts. With inflation expected to remain subdued for the next 2-3 years, a yield of over 9% (on offer from R2030s at present) will equate to a real return of 5%-6% p.a. over the next 2-3 years.
Below, we present this outlook graphically – mapping SA inflation (a monthly printed figure) vs the yield on offer from the R2030 bond (using daily close mid quotes).
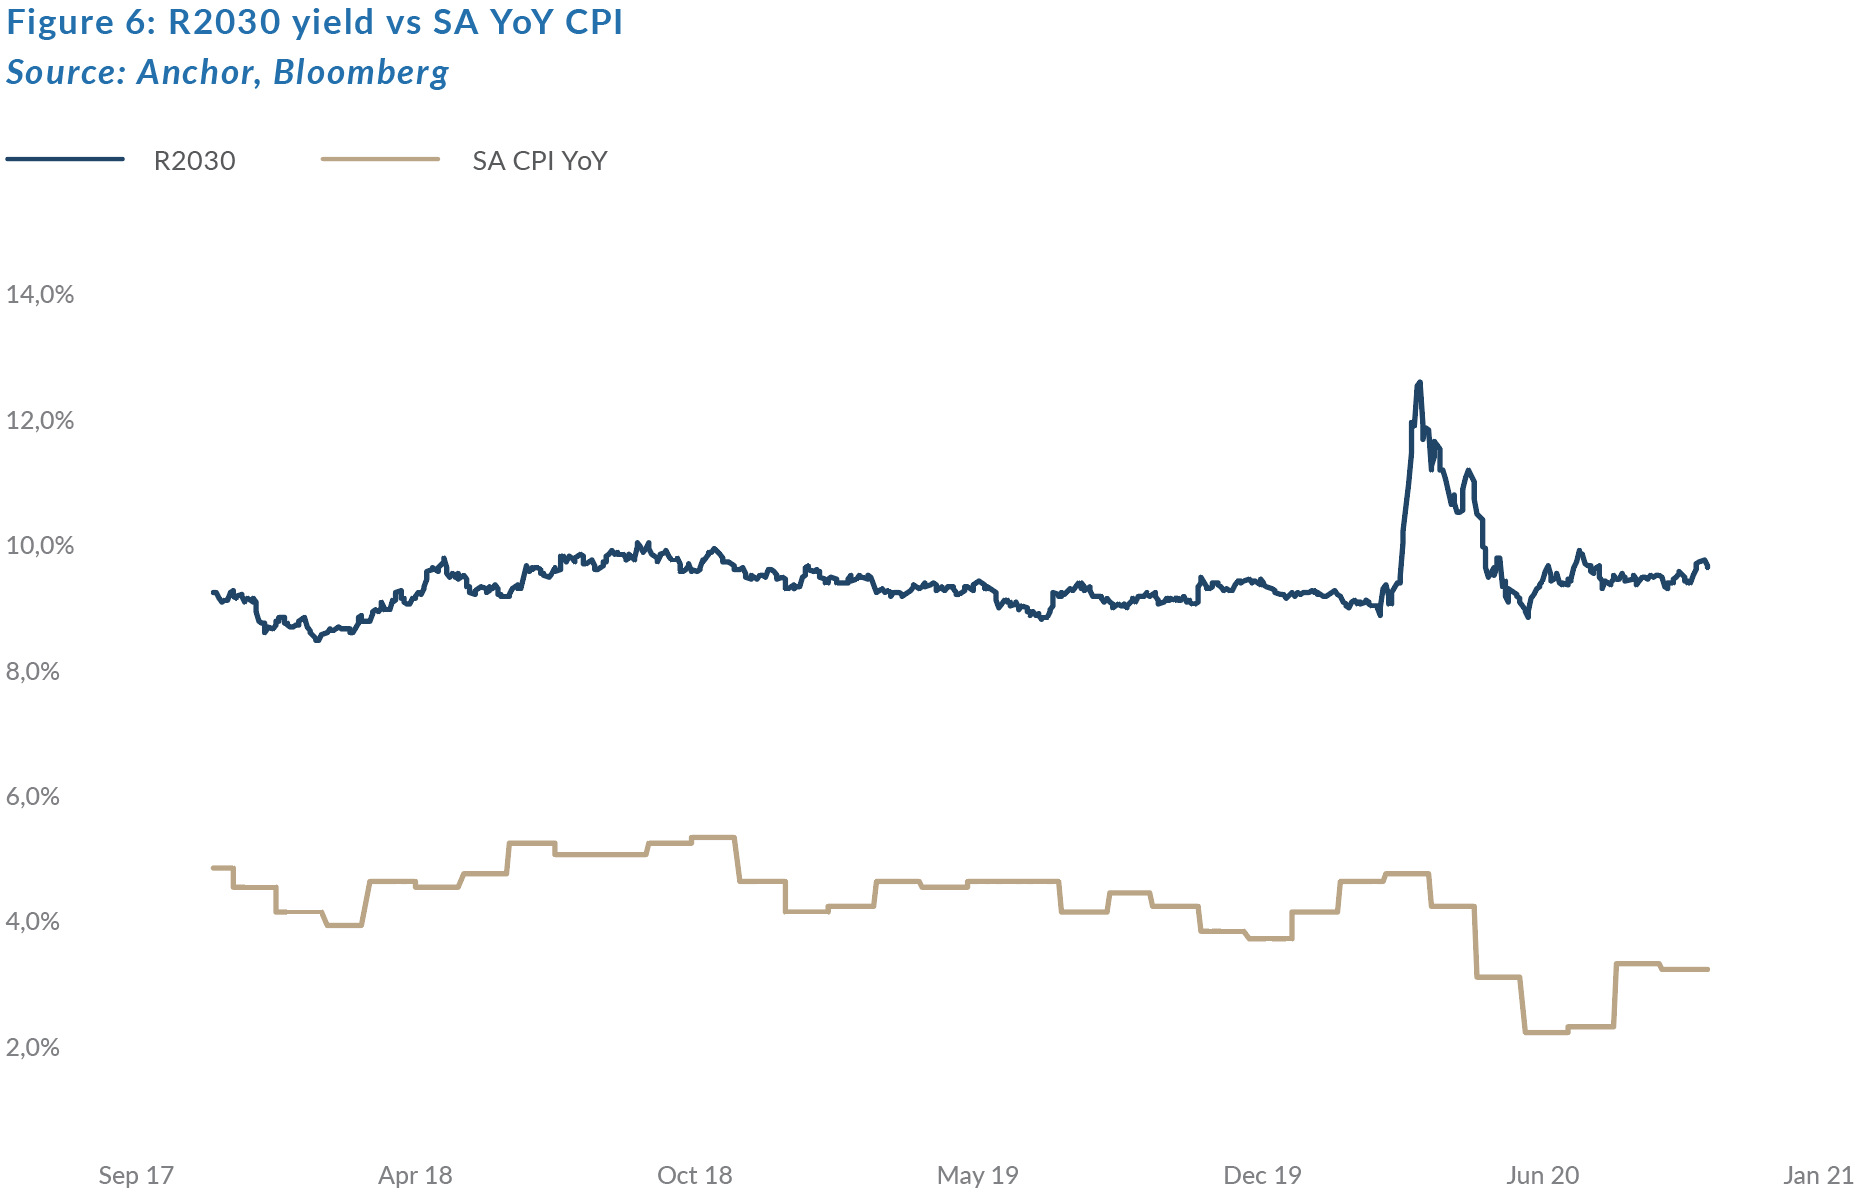
As can be seen in Figure 6, the R2030 presents as a highly attractive investment in a low-inflation environment at current yields.
The major risk factor and opportunity factor to the above remains the same – the domestic political outlook shifting dramatically one way or the other. The current milieu appears to be turning sharply against corrupt factions within the ruling ANC, investigations are bringing to light the depths of the graft, and prosecutions seem inevitable. However, a meaningful SA recovery is likely to be slow and fraught with risk. We expect that bonds yields will trade largely sideways but remain volatile. This gives us an expected return of 9.3% from bonds for the next year.
Rand
Projecting the rand’s value in a year’s time is a fool’s errand. The rand vs US dollar exchange rate is one of the world’s most volatile currency pairs and trades well away from any modelled fair value for long periods. We note, however, that the rand trades within a R2.50 range to the dollar in most 12-month periods and after the rand’s extreme weakness in March, the local currency has been clawing back some of those losses.
We maintain our view that, while the rand should trade on the weaker side of fair, it is oversold at current levels and therefore, as the world recovers from this crisis, we see scope for the rand to recover more of its losses. Nevertheless, we also think that this will be a slow process and that, for now, the rand will remain range bound in a volatile environment with a slight strengthening trend over time. As with all asset classes, the near-term outlook for the COVID-19 crisis also dictates the near-term outlook for the rand.
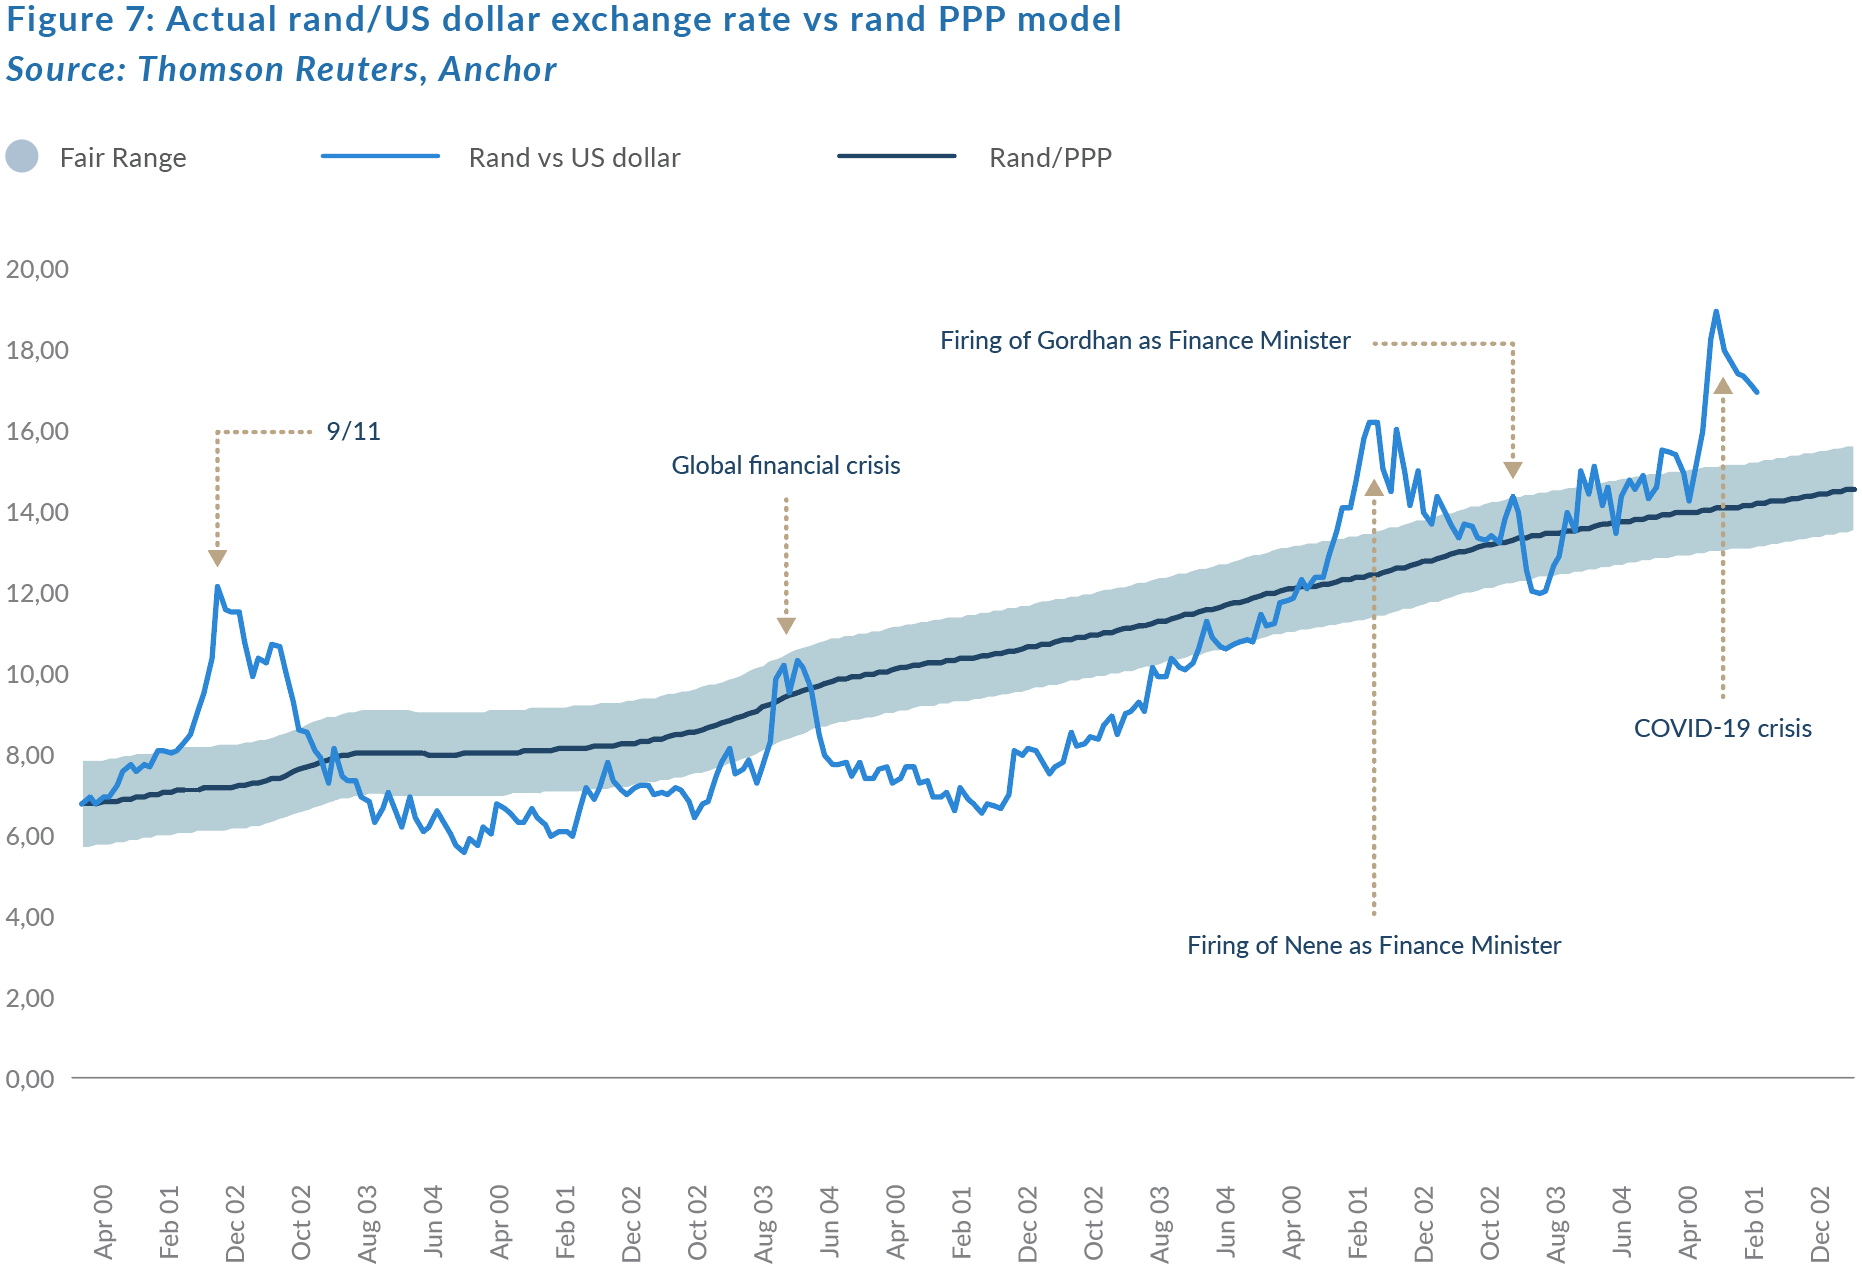
We retain our purchasing power parity (PPP) based model for estimating the fair value of the rand and we have extended this out by three months since the publication of The Navigator – Anchor’s Strategy and Asset Allocation, 3Q20 report on 14 July 2020. Our PPP-modelled value for the rand vs US dollar at the end of the next 12 months is R14.20/$1 (See Figure 7). We apply a R2.00 range around this to get to a fair value range of between R13.20/$1 and R15.20/$1.
We expect the rand to remain particularly volatile and on the weaker side of our fair range band. This would imply that we see scope for up to a 6.6% improvement from the rand’s current levels as the world recovers.
Global Equity
Following three quarters of the 2020 equity market roller coaster, the MSCI World Index is up 2.1% YTD in US dollar terms – an outcome few would have predicted in the depths of the March 2020 market crash. Unprecedented global stimulus came to the rescue (largely in developed markets) and, thus far, investors have been prepared to look through the COVID-induced economic slump.
In 3Q20, the MSCI World posted a US dollar total return of 8.0%, while the MSCI Emerging Markets Index recorded a 9.7% gain over the quarter. In September, global markets finally wobbled after a five-month winning streak as most major equity benchmarks lost ground. The tech-heavy Nasdaq 100 Index fell by over 10% in three days in early September but recovered somewhat to end the month 5.7% lower. Despite its September wobble, the Nasdaq is still up 31.6% YTD – well ahead of the S&P 500 (5.6% YTD) and Japan’s Nikkei 225 (+2.8% YTD in US dollar terms), which are the only other two major equity markets in positive territory for 2020. There was no clear catalyst for the September declines, although the continued inability of US Congress to agree to new fiscal stimulus measures and a new wave of COVID-19 infections in Europe likely contributed.
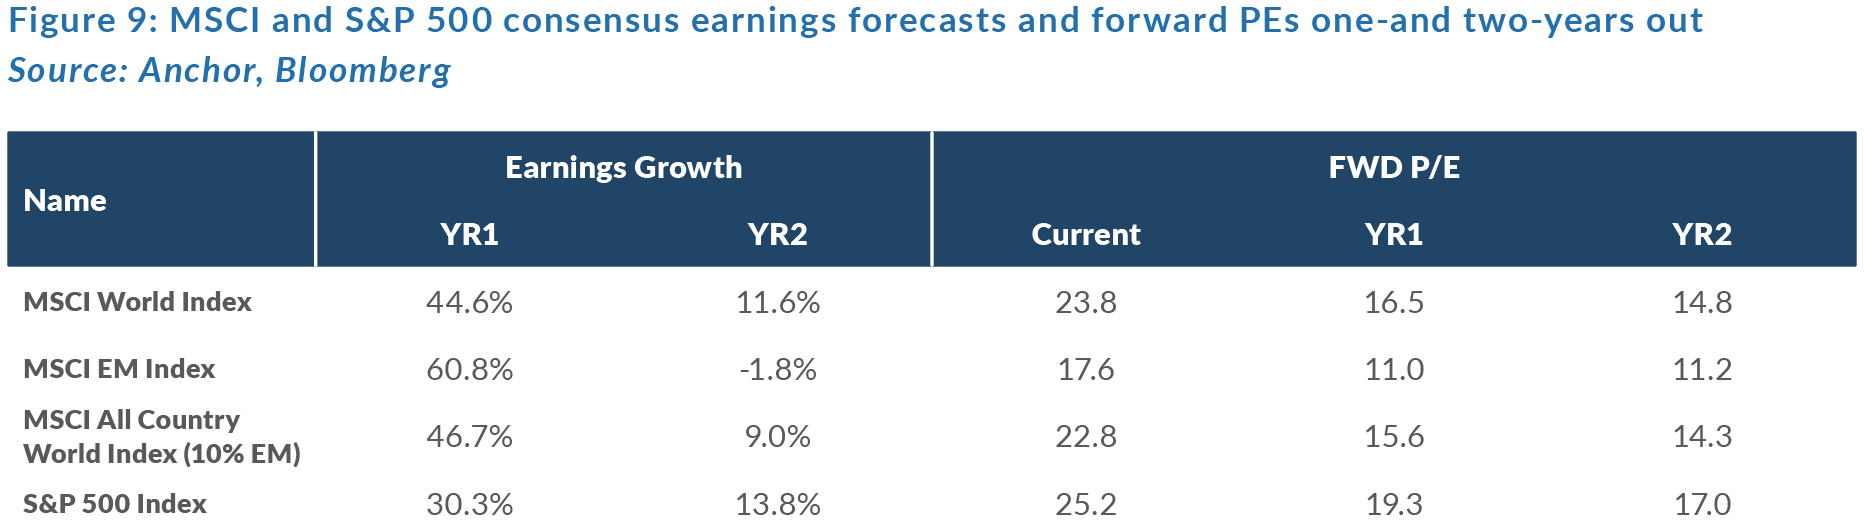
With markets flat and earnings slumping, the MSCI World forward PE has risen to expensive levels, although a predicted earnings recovery will reduce the valuation in the ensuing two years.
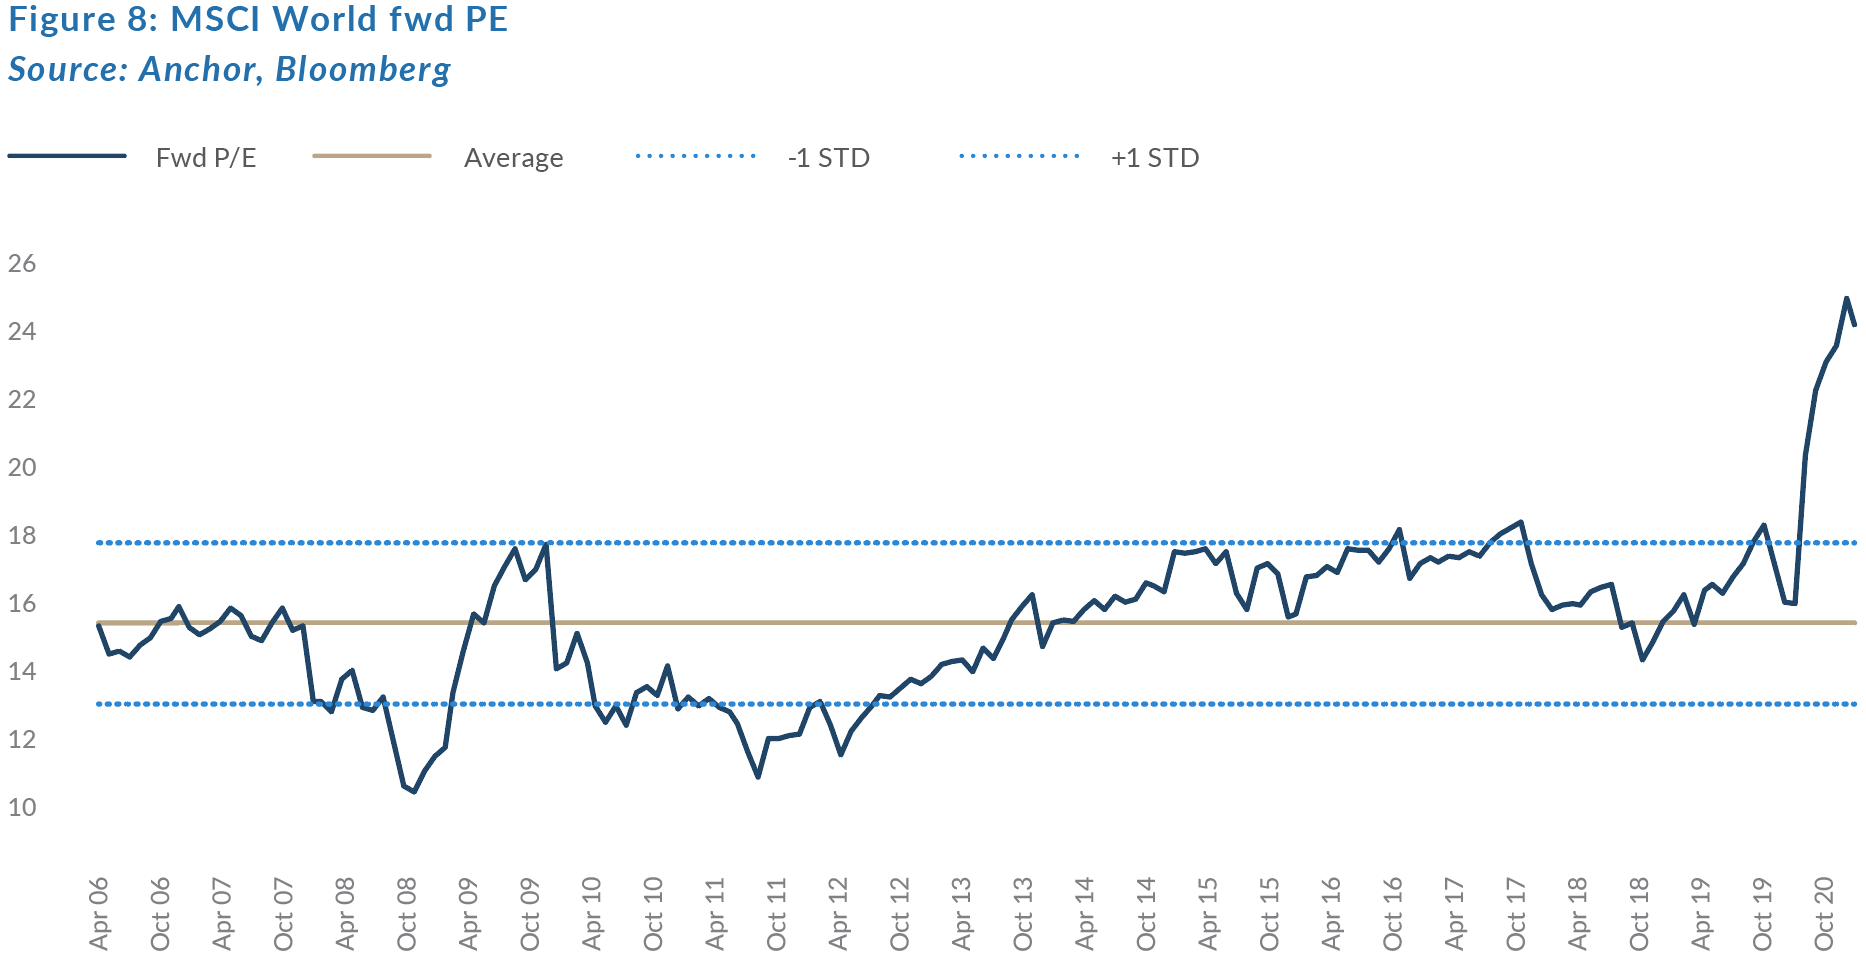
This is reflected in Figure 9 below, which indicates that consensus earnings forecasts show a 45% recovery in the next 12 months, reducing valuations back to slightly ahead of historic averages.
Global markets should be broadly viewed in two segments:
- The future of technology companies (now accounting for over 35% of US equity markets) accelerated in 2020 as the global consumer shifted their expenditure online. There have been some phenomenal performances from tech shares this year and this segment of the market is probably due for a breather. We find the asset-light compounding nature of these businesses very attractive and essential in a long-term investment portfolio. Stock-picking has become increasingly important in an environment of elevated valuations. We think most of the winners for the next decade are in this sector.
- Industrial and financial services shares are generally still well below their January 2020 highs and there are attractive opportunities in this space as the world returns to normal. Our focus is on businesses that have sound balance sheets and will revert to 2019 earnings in 2021/2022.
The COVID-19 pandemic continues to occupy the minds of investors, but it should be borne in mind that it is not the pandemic itself that matters, but rather the fear of the virus and government and consumer reaction to this. We think fear is subsiding, but the reality of higher unemployment and lower benefits will influence the future. An effective vaccine will be good for markets.
The US Presidential Election scheduled for 3 November, will dominate headlines in the current quarter. Polls are pointing to a Joe Biden victory, which will result in a large fiscal stimulus and should be positive for global equities.
While global equity index levels are close to flat, the performance of different sectors has been marked. On an aggregate basis, we project a 5% return from global equities in the next 12 months, with valuations starting at fairly full levels. The bulls argue for higher valuations, as the cost of money is lower (probably for an extended period) and alternatives are limited. However, within the global equity market we think there are significant opportunities.
Global Bonds
The US Fed’s gargantuan effort to ensure that liquidity did not dry up during the COVID-19 market collapse, saw it almost double the size of its balance sheet from $4.2trn in February to $7.2trn in May. It was not alone in its effort to flood global markets with liquidity and the $3trn liquidity injection from the US Fed was supplemented by about $2.4trn from the ECB (whose balance sheet is even larger than that of the Fed at $7.7trn) and $1.2trn from the Bank of Japan, which went into March 2020 with the largest balance sheet ($5.2trn), but emerged slightly behind the US and the EU with a balance sheet of $6.5trn.
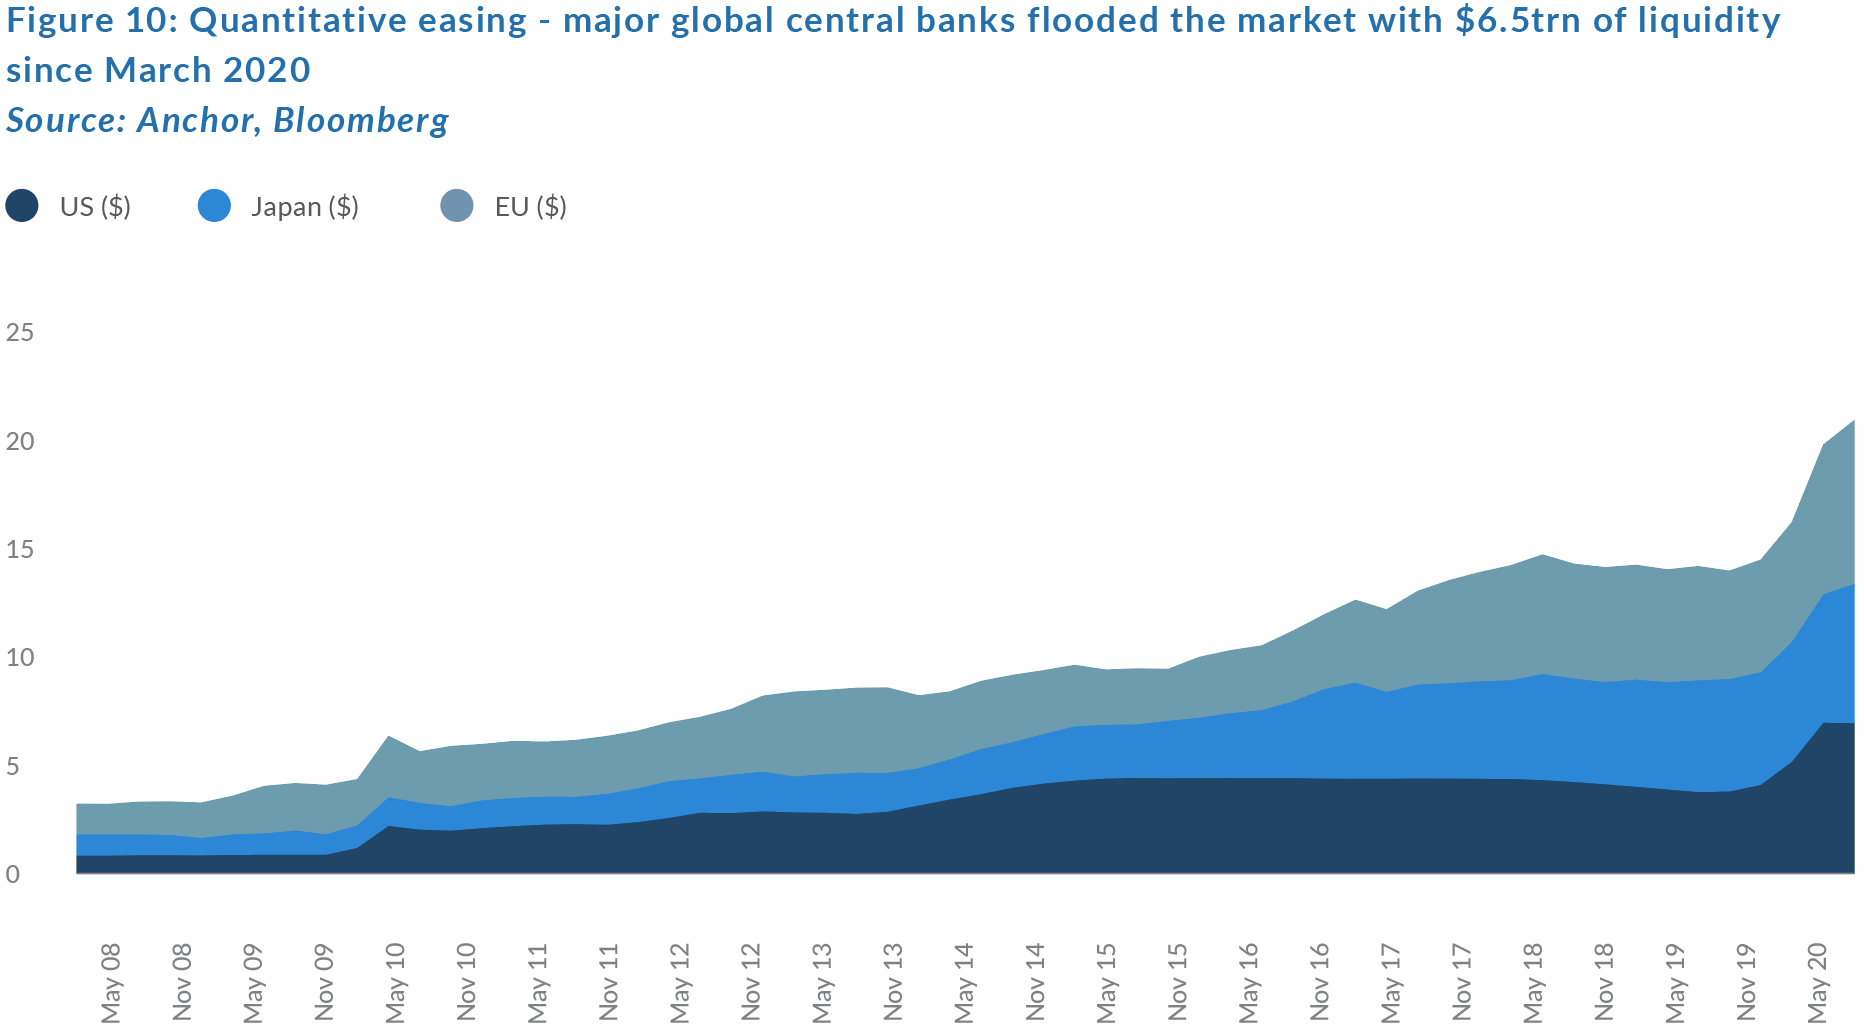
The Fed expanded beyond its traditional quantitative easing (QE) method (buying government bonds), to injecting dollars directly into the corporate bond, municipal debt, and commercial paper markets. It has also been providing loans directly to companies and supplied almost $0.5trn directly to foreign central banks. Interestingly, most of the liquidity injected into these peripheral QE programmes (which totalled about $0.8trn over March and April) has now essentially been repaid with corporate bond markets and foreign central banks no longer requiring the additional liquidity. So, despite continuing to purchase about $80bn of government bonds each month, the Fed has not grown its balance sheet over the last few months.
The fact that these additional sources of liquidity are no longer required by corporates and foreign central banks is fairly encouraging as an indicator of economic stress in those markets. It is also comforting for high-grade, corporate bond investors to know that liquidity risk, which was becoming a major concern as a result of post-global financial crisis (GFC) regulations, which effectively prevented commercial banks from acting as the buyer of last resort, has been fixed by the willingness of major central banks to step into that role in size. This gives us relatively more confidence in estimating the path of US investment grade corporate bond spreads, which we think could potentially contract to around 1.2% over the next twelve months.
We expect US core inflation to edge marginally higher over the course of the next twelve months, from the current level of 1.5% to around 1.7%. We still believe the major influence on US 10-year government bond yields will be from demand (QE) over the forecast horizon, with only a modest term premium. Any return to a more fundamentally based valuation, where investors expect a reasonable real return from US government debt, will probably be a fairly long way off. As such, we expect US 10-year government bond rates to reach only 0.8% twelve months out. This leaves us with a total return forecast for US 10-year government bonds of -0.2% over the next twelve months and a total return on US investment grade corporate bonds of c. 2.0% over the same time horizon.
Global Property
In 3Q20, we saw a continuation of the previous quarter’s (2Q20) theme – strong returns from online-related sectors such as data centres and warehouses and the continued poor performance from old brick-and-mortar sectors such as retail, office, and residential. Particularly noteworthy during the quarter was the announcement by Unibail-Rodamco-Westfield (URW), one of the largest global retail REITs, that it planned an equity raise to shore up its balance sheet. This announcement saw URW’s share price drop by 20%, increasing its discount to NAV from c. 80% to c. 85%. A 2018 transaction in which Unibail-Rodamco merged with Westfield in a 40% debt-funded deal saw URW’s loan-to-value (LTV) ratio jump to 37% (close to its 40% internal threshold). That LTV ratio has now crept up to around 41.5% (although it remains comfortably below the 60% covenant levels). URW will ask shareholders to vote on the EUR3.5bn capital raise in early November. If successful, shareholders will need to stump up EUR25.2/share on a counter whose share price is currently trading at around EUR31. In addition to the equity raise, URW is looking to sell EUR4bn of assets (primarily Paris offices [offices currently account for less than 10% of its portfolio]), in an attempt to get its LTV ratio down to around 30% and maintain its investment-grade credit rating (and, in turn, its continued access to cheap funding).
The market reaction to URW’s capital raise is also an indication of investor appetite for the sector and skepticism around the future value of retail assets globally. This is a sector where US retail heavyweight, Simon Property Group (SPG), is suing its largest, non-anchor tenant, the retailer Gap, which accounts for c. 3.5% of SPG’s total rentals, for non-payment of rent during the COVID-19 related store closures. So, clearly it is a sector in deep turmoil.
During the GFC, US retail vacancies increased for six consecutive quarters from <6% to over 9% and took twice as long (three years) to get back to below the 6% vacancy level. And that was in an environment where online shopping was less of a threat than it is today! So, it’s unlikely that vacancies have troughed and very likely that the path back to decent occupancies will be a slow one. The big question is whether the huge discounts to NAVs already reflect that eventuality.
Office REITs, particularly those in major urban areas, are significantly less exposed to the hardest hit sectors (retail and hospitality), being vulnerable predominantly to the more resilient tech, media, and finance sectors. Questions around how long the work-from-home (WFH) trend will continue and whether it is a temporary or structural shift remain. Rental collections and vacancies have held up relatively well, but valuations in the sector reflect a belief that WFH trends are probably structural with quality US office REITs such as Boston Properties trading on a forward dividend yield that is about 4% ahead of US 10-year government bond yields (which is around the peak levels it reached during the GFC, when its tenants were in the eye of the storm).
On the opposite end of the spectrum, delays in additional supply in the warehouse and data centre space, as new construction is hampered by the pandemic, are driving solid rental growth there. However, we expect this supply shortage to be more cyclical in nature and, as such, current yields of around 3%–4% with less scope for development driven growth seem fairly full. All told, we think the 4% estimated forward dividend yield at the sectoral level is likely to be partially offset by a slight derating in some of the highly-rated sectors’ growth prospects and a further deterioration in retail sector income will leave investors with a total return of around 2% over the next twelve months.