ECONOMICS
As we enter the second half of 2021, (and notably a year and a half since the onset of the COVID-19 pandemic), the global economy is poised to stage its most robust post-recession recovery in 80 years. However, the rebound is expected to be uneven across countries, as major economies look set to register strong growth even as many developing economies lag. The key risk to global growth prospects continues to be the pandemic. The rapid spread of the more transmissible Delta variant across the globe is a cause for concern. However, evidence suggests that vaccinations are an effective tool against this new variant, breaking the link between infections and hospitalisations. Despite the rapidly evolving risks, economic sentiment continues to track higher, resulting in some central banks heading towards monetary tightening. The US and China are each expected to contribute about one quarter of global growth in 2021. The US economy has been bolstered by massive fiscal support and a rapid vaccine drive under President Joe Biden’s administration. Subsequently, growth is expected to reach c. 6.8% this year – the fastest pace since 1984. China’s economy (which did not contract last year) is expected to grow by a solid c. 8.5% YoY in 2021 and then moderate as the country’s focus shifts to reducing financial stability risks.
Growth among EM and developing economies is also expected to accelerate, assisted by increased external demand and higher commodity prices. However, the recovery of many countries is constrained by resurgences of COVID-19, uneven vaccinations, and a partial withdrawal of government economic support measures. Regionally, the recovery is expected to be strongest in East Asia and the Pacific, largely due to the strength of China’s recovery. In South Asia, recovery has been hampered by serious renewed outbreaks of the virus in India and Nepal. The Middle East, North Africa, Latin America, and the Caribbean are expected to post growth too shallow to offset 2020’s contraction. Sub-Saharan Africa’s recovery, despite being boosted by spillovers from the global recovery, is expected to remain fragile given the slow pace of vaccination and delays to major investments in infrastructure and the extractives sectors.
Amidst the global easing of social restrictions and strengthening demand, one market segment that has seen some notable moves has been commodities. For example, YTD, oil and gas prices have witnessed gains of 47% and 42%, respectively, whilst other hard commodities such as iron ore and copper, amongst others, have also seen double-digit gains. The sharp rebound in activity is pushing up commodity prices, driven by factors such as supply shortages and logistical bottlenecks. Ultimately, this is showing up in various inflation figures, albeit on a temporary basis. Despite clear evidence of price pressures within the US economy, Federal Reserve (Fed) Chair Jerome Powell has remained committed to the message that this upward momentum in prices is transitory in nature. Markets are pricing in a slightly more aggressive Fed in the near term, while appearing more convinced that inflation will be under control. Our baseline expectation is that inflationary pressures will indeed subside, although we do acknowledge the risk of more persistent price rises than first envisioned.
Locally, SA’s third wave of the pandemic was always a likely event, and indeed a fourth and even a fifth wave as well, given the very slow pace of vaccine rollout – which only started to accelerate in June. Whilst notable downward risks remain, economic recovery is still progressing fairly well. Nonetheless, SA’s economic activity will be patchy, with this unevenness between sectors influenced by lockdown levels. Positively, SA has seen a recent quickening in its pace of growth-enhancing economic reforms (and notably a strong and committed anti-corruption drive), which supports the view of a longer-term acceleration in economic growth once the distorting effect from last year’s base effects dissipates. Concerningly, unemployment sits at a record high of 32.6%, with 1.4mn South Africans, who were previously employed before the harsh lockdown restrictions of level 5 last year, still out of work. This has set SA’s job creation back by seven years. With some EMs hiking interest rates, SA will follow suit, although likely only from next year onwards. The rand has seen marked strength but will not see the same extreme appreciation it has since April 2020. Whilst consumer spending has rebounded soundly thus far, further growth will be dependent on consumer confidence, employment, access to credit, the effects of inflation, as well as disposable incomes (which could suffer in 3Q21 amid the third wave of the pandemic), with light lockdown restrictions key to the overall outlook.
SA EQUITIES
After a strong first quarter performance at an index level for the JSE, 2Q21 proved to be more challenging, with the FTSE/JSE Capped SWIX only managing to eke out a marginally positive return (+0.6% for the quarter), bringing the YTD number to a 13.3% gain. Looking through the headline number, 2Q21 brought about a big sectoral shift in leadership, with the most notable being the outperformance of domestically focussed counters over the basic materials producers and rand-hedge industrials. The latter’s returns being somewhat suppressed by the appreciation of the rand by c. 3% QoQ against most major trading currencies.
Much has transpired over the past quarter for investors on the JSE, including better-than-forecast operating results from large economically sensitive bellwether companies, which provided an underpin to the domestic bourse’s outperformance. Commodity prices, even though they are off their recent highs, remain at levels far higher than the consensus forecasts are currently expecting over the next 12 months. The increased earnings expectations 12-months out, coupled with a roughly flat quarter for the index, has resulted in our one-year forward, total return expectation increasing to 14%, up from the 12% we were expecting in 1Q21. The key risks to our return forecast remain the disappointingly slow vaccine rollout in SA, and the onset of a devasting third wave of COVID-19 and the much more contagious Delta variant. However, these factors remain a more serious humanitarian concern than necessarily one for the stock market, which will once again most likely be more influenced by outside events linked to the rapid improvement of the US economy, which will influence the global cost of capital, and the demand for key commodities from our largest commodity trading partners – China and Europe.
Not since the change in the ANC leadership at the end of 2017 (when Cyril Ramaphosa became president of the party), have we seen such a sharp outperformance of domestic counters on the JSE. We note that, not only has sentiment seen a marked shift in the right direction but, for the first time in many years, the outperformance of these stocks has been underpinned by better-than-expected financial performances across the board (from banks to retailers to industrial businesses) and positive earnings revisions, not merely multiples expanding. The onset of President Cyril Ramaphosa’s New Dawn brought about much hope, but not a lot in the way of positive earnings revisions, and the outperformance of JSE-listed shares faded relatively quickly. This time round, with earnings expectations too low and some high-quality operational performances across the various sectors, the outperformance has been more fundamentally driven than merely sentiment driven.
Nevertheless, as the third wave of the pandemic ravages the country it is difficult to conclude that, at the margin, on the ground, conditions locally are incrementally better than they were at the start of this year. However, from our interaction with many stakeholders and continuously better-than-expected hard data points and company results, this does seem to be the case. Market participants have once again been reminded of just how important the commodity cycle is for the country, not necessarily the direct GDP impact (this remains relatively small at c. 8% of overall GDP), but more the second- and third-order impacts that tend to permeate across most spheres of the economy.
Unfortunately, commodity markets and cycles are notoriously fickle and, in the short term, are clearly masking the deep structural challenges faced by SA. Unemployment and the lack of fiscal flexibility, underpinned by inefficient policy, has become more self-fulfilling as many of the companies we analyse and speak to remain unwilling to deploy meaningful capex that would not only provide a kicker to earnings but would also kick-start the economic flywheel. Still, we are particularly encouraged by government’s decision to allow independent power producers (IPPs)to produce up to 100 megawatts of power, up from the initially suggested 1 MW.
Arguably the most disappointing event that has transpired for investors over the past quarter was Naspers and Prosus’ underwhelming proposal to, in effect, increase the cross holding between the two companies, reducing the shares in issues via an accounting technicality and thereby, according to management, increasing the NAV per share by roughly 9%. As investors in these companies (like most investors on the JSE), we have been waiting for management to come up with a sustainable solution to addressing the “distractingly” high discount to NAV at which the stock is trading. However, the proposed solution does not go nearly far enough to incentivise shareholders to rerate the counter, in our view. We use the term “distractingly” high because we feel the discount remains too much of an issue for investors to look past it and focus on the strong operating performances of the investment portfolio and the exciting prospects of the businesses in which they are investing billions of dollars.
It has become clear that there is not enough incentive for management to do whatever is necessary to close the discount, namely unbundle Tencent and have it as a separate listing on the JSE and collapsing the control structure at a Naspers level. Outside of that, we cannot see any other sustainable solution to addressing the discount (although we concede that we do not have the intricate detail of the structures and the range of potential possibilities available to us). We do, however, feel that the most recent bout of investor fatigue has seen the discount shoot out to extreme levels and Naspers/Prosus remains one of our top picks for the upcoming quarter, largely driven by our optimism for the prospects of Tencent, relative to the domestic opportunity set.
The recent underperformance of the basic materials sector on the JSE (a 2% drag on the index over 2Q21) and corresponding positive earnings revisions should intuitively result in an incrementally more positive outlook over the coming quarter (3Q21) relative to 2Q21. Global inflation concerns, and supply chain issues over the quarter seemed to result in elevated levels of speculative activity in many commodity markets, however in recent months these appear to have eased. Company balance sheets remain strong, and we have not yet seen the signs of poor capital discipline that has plagued previous cycles. However, front of mind for us when forming a view on the sector, once again, has very little to do with the supply/demand of the commodities and more to do with the expected glide path of asset tapering in the US and the impact that this will have on sentiment towards the US dollar and, potentially, the relative levels of certain commodity markets (and certain EMs).
Working on correlations such as these, once again reminds us that analysing and investing in this space requires a different set of disciplines (more top-down), than what we would typically apply (more bottom-up), when analysing and investing in businesses. We remain sceptical of optically low P/E multiples in the context of near peak-of-cycle margins. However, after having reflected on the various scenarios, our view is that, over the near term, enough support exists to maintain most of the basket prices of the businesses in our investment universe and, with the recent pullback in equities, we have been increasing our exposure to both platinum group metals (PGMs) and the diversified mining sector.
SA LISTED PROPERTY
SA listed property has been the best-performing asset class this year, with a 19% return from the FTSE/JSE SA Listed Property Index (SAPY) for the first six months of 2021. While on the ground property remains under considerable pressure, share prices at the beginning of the year were pricing in a dire outcome. It has not turned out as badly as the market had anticipated.
The reason for this is that the local market was positively impacted by:
- The recovery in economic activity, which has been stronger than we had expected,
- rural and township retail, which has been very resilient (there have also been some signs of an improvement in urban retail),
- liquidity both from debt and equity sources has been more robust than our expectations,
- the appetite towards this asset class seems to continue to improve (although it remains somewhat “fragile”), and
- balance sheet repair has been faster paced than our initial expectations.
All of the above are positive, but our forecast of an 11% return over the next 12 months is only just above the forecast dividend yield (dividends yields are difficult to forecast, especially given the range of outcomes and payout ratios, but should be in the region of 8% and 10%, with our official projection at 8.6%). Listed property companies are now generally only paying out 75%-90% of earnings, compared to 100% in the past. Some of the more leveraged players are not paying any dividends.
Property companies have mostly abandoned giving forward projections, compared to the tradition of prior years, when the certainty of rentals enabled these companies to provide tight forecast dividends for the coming year.
SA listed property is optically still cheap, with discounts to book net asset value of 20%-40%. However, we believe that physical property will remain under pressure for the next few years as rentals adjust downwards to reflect the high level of vacancies. We expect book net asset values to continue being written down to reflect the market’s more appropriate assessment of actual underlying value.
In its latest trading update, bellwether Growthpoint reported negative retail rental reversions of 15.2% for the leases that ended, and its office vacancies currently stand at 19.2% (vs the SA Property Owners Association’s [SAPOA’s] average of 15% vacancies). An indication of the future is Polish retailer EPP, which in May reported its current footfall rate at 82% of pre-COVID levels – this for a country which is at an advanced stage of the vaccine rollout.
While there will be structural pressure on earnings for the next few years, in the shorter term (over 12-18 months), there will be some positive rebounds to bolster earnings as the economy opens again and tourism returns (in the case of Growthpoint, the V&A Waterfront is driven by inbound tourists). SA’s third wave of the virus (the more contagious Delta variant), will have a material negative short-term impact, but both tenants and landlords have more experience of how to deal with this.
DOMESTIC BONDS
After 1Q21 ended with a period of weakness for SA government bonds (driven by the increase in US 10-year treasury yields), 2Q21 has been far less active in terms of yield movements. Whereas 1Q21 experienced yield highs of 7.76% and lows of 6.57% on the R186, 2Q21 saw 7.55% and 7.10%, respectively (a range of 1.19% in 1Q21 and only a 45-bpt range in 2Q21).
As we approach 2H21, we expect the key consideration going forward to be the SA Reserve Bank’s (SARB’s) Monetary Policy Committee’s (MPC) decisions on the repo rate. Currently the repo rate is at 3.5% – a record low. It has been at this level since the start of the COVID-19 crisis in March 2020. The forward rate agreement (FRA) rates are currently pricing in 200 bpts of rate hikes over the next 21 months, with 100 bpts in rate hikes being priced-in over the next 9 months. We think that these rate-hike expectations are excessive for the local economy and we therefore see some prospect of capital gains in short-dated bonds.
This rate-hiking environment has the most substantial impacts on shorter-dated SA government bonds, where the front of the curve is pegged down by the repo rate. Currently the R186 yields 7.445% – a spread of nearly 4% vs the repo rate (for taking on 5.5 years of government debt). Given these dynamics, SA bonds remain attractive instruments, most particularly the “belly bonds” (the “belly” is the central portion of the curve – in our case the 10- to 20-year bonds). These bonds currently offer the most attractive yield-to-term dynamics and we retain a material and strategic overweight on these bonds (the R2030, R213, R2032, R2035, and the R2037).
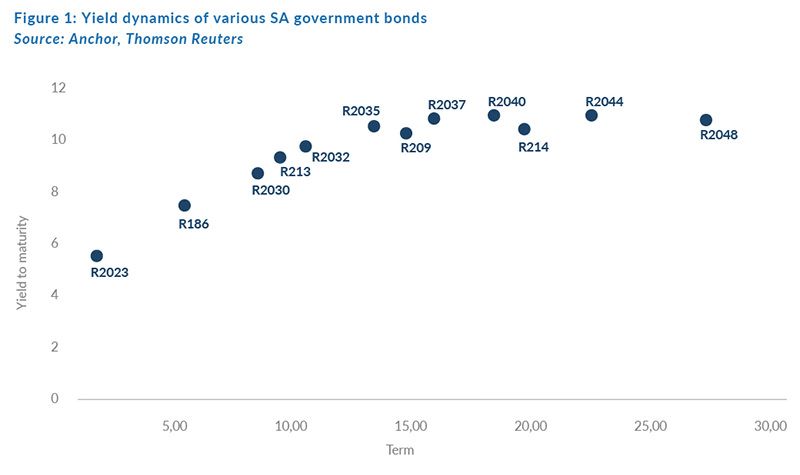
As Figure 1 above shows, the attractiveness of long-term debt is constrained, with the steepness (or yield difference) between the R2048 (27 years to maturity, the longest SA government bond [SAGB]) and the R2037 (16 years to maturity, the “belly”) being 13 bpts – for an additional 11 years of term to maturity. Conversely, an accommodative SARB MPC has resulted in short-end bonds offering anaemic yields (the short-end R2023, for example, yields 5.3% at present).
Overall, 1H21 has offered SAGB investors a good outcome. Central banks are likely to reduce their stimulus over the next year and, while this will act as a drag on our bonds, we expect SA bonds to move broadly sideways. The index itself yields approximately 9% at present, which would give a one-year return for an All Bond Index (ALBI) investor of just under 9%.
THE RAND
Strong exports of both commodities and manufactured items such as motor cars have seen SA’s trade balance average a surplus of just over a R50bn per month for 2021. The trade balance has been exacerbated by both the lockdowns and the poor domestic economy, which has seen imports being below what we had expected. The net result is that foreigners are buying R50bn of local currency per month to pay for our exports. This has given a solid boost to the rand, which traded firmer at R13.75/US$1 for a period.
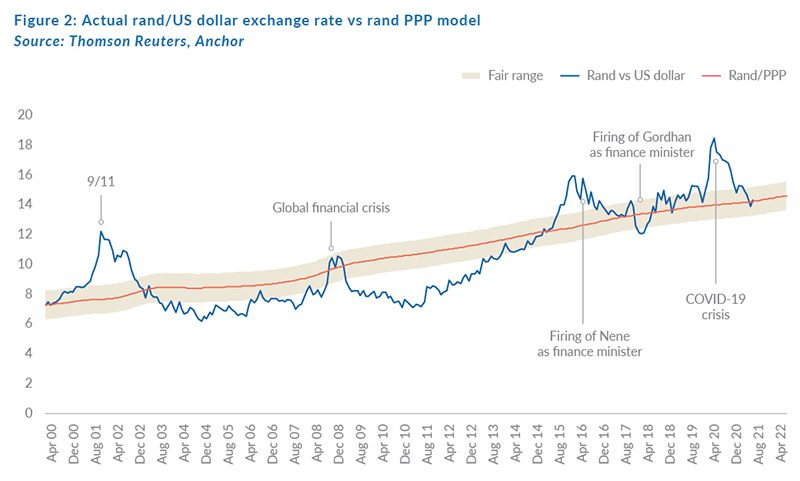
Towards the end of the quarter, fears that the US Fed would begin to taper bond purchases has pushed the rand slightly weaker. In the chart below (Figure 2), you will see that the rand is essentially at the midpoint of our fair value range.
Projecting the rand’s value in a year’s time is a fool’s errand. The rand vs US dollar exchange rate is one of the world’s most volatile currency pairs and trades well away from any modelled fair value for long periods. We note, however, that the rand trades within a R2.50 range to the US dollar in most 12-month periods.
We retain our purchasing power parity (PPP) based model for estimating the fair value of the rand and we have extended this out by three months since the publication of The Navigator – Anchor’s Strategy and Asset Allocation, 2Q21 report on 9 April 2021. Our PPP-modelled value for the rand vs US dollar at the end of the next 12 months is R14.45/US$1 (See Figure 2). We apply a R2.00 range around this to get to a fair value range of between R13.45 and R15.45/US$1.
We expect the rand to remain particularly volatile even though we do think that it may continue to trade with a strengthening bias, while the trade balance remains supportive.
GLOBAL EQUITIES
Global equity markets have hit record highs at the 2021 half-year mark, as company earnings materially exceed expectations of six months ago. We expect this bull market to continue in the short term but, on a 12-month view, the risk is that the earnings rebound might well have already been priced in. We look for our returns at the company level, where quality growth companies are still accessible at reasonable prices.
The behaviour of the US stock market can best be explained by Figure 3 below, which shows projected 2021 earnings of the S&P (USc191), 16% higher than pre-pandemic 2019 (USc152), implying stronger businesses than pre-COVID. Importantly, another 11% earnings growth is projected in 2022 (to USc213), suggesting that the momentum can be sustained.
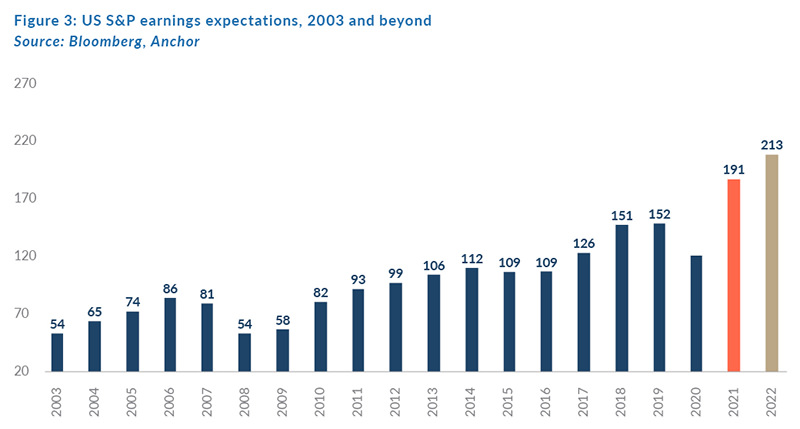
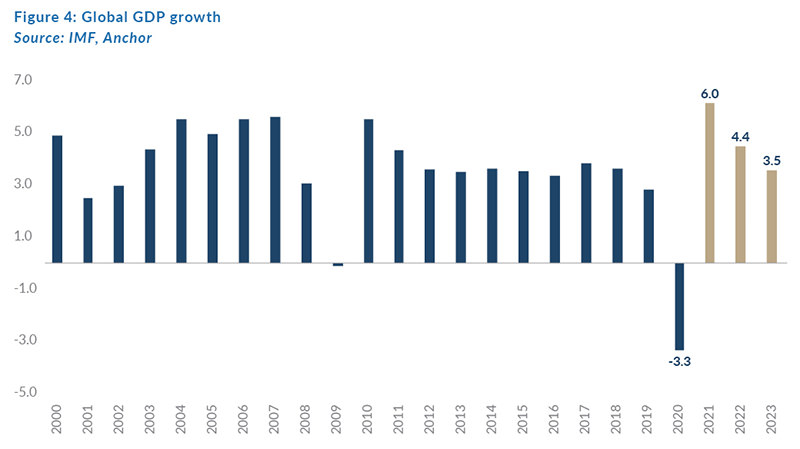
Figure 4 below tells the same story, with global GDP (the primary driver of earnings growth) looking strong in 2021 (+6% YoY) and 2022 (+4.4% YoY). Governments have stepped in to counter the COVID-19 pandemic, with massive fiscal stimulus, free money, and low interest rates. Consumers have responded with a massive spending spree and the majority of listed businesses have leveraged off the rebounding spend.
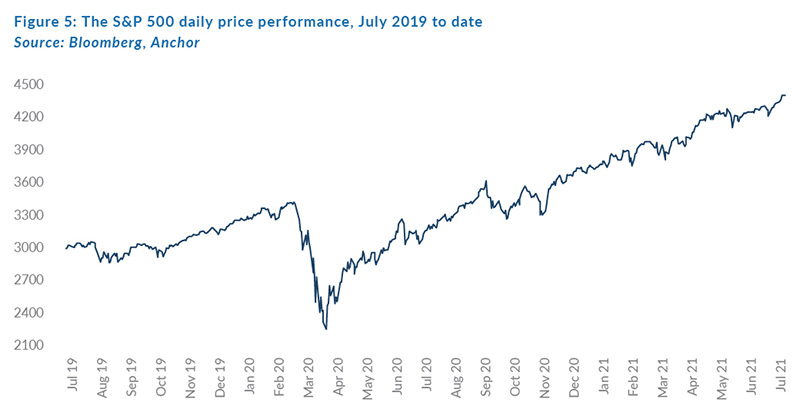
Stock markets are a barometer for future expectations. The March 2020 crash priced-in the potential for a horror pandemic outcome, but the subsequent generous reaction of governments and the realisation that the pandemic would be managed, set the markets off on an unstoppable upward path. This was aided by ever-increasing earnings growth forecasts, higher commodity prices, and new cash being hurtled into the market. Global equity markets returned 16% in 2020 and the scorecard shows a 12% return for the first six months of 2021. A healthy portion of the earnings growth and market returns have been driven by the improving outlooks and reratings of technology shares, many of whom had their futures accelerated by 2-5 years as consumers shopped on their laptops rather than in malls and embraced a digital future.
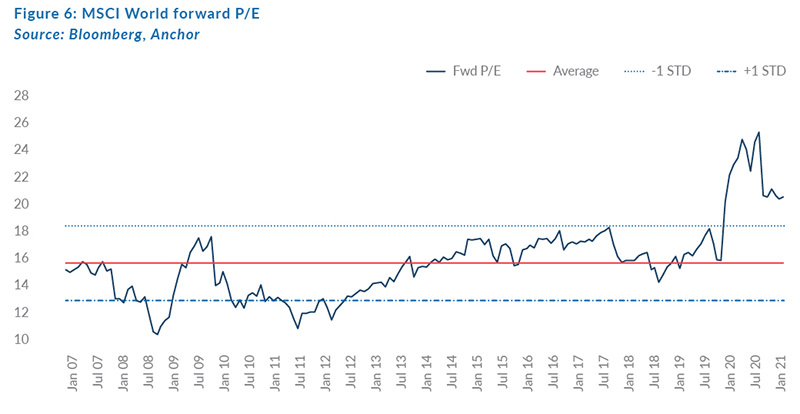
This has resulted in a material rerating of each dollar of earnings, as reflected in Figure 6 below, which shows the world forward P/E multiple (incorporating the recovery for the next 12 months) at a lofty 21x – 25% ahead of the average over the past 15 years.
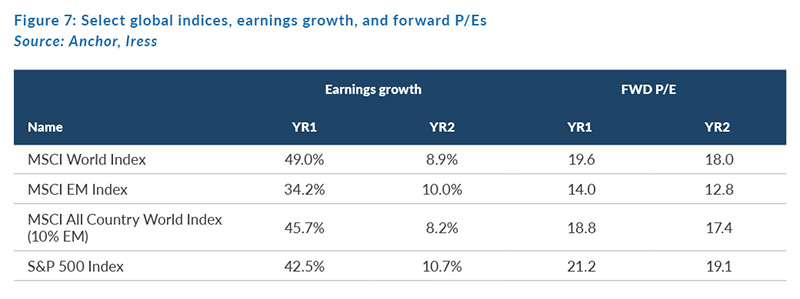
The above is further illustrated in the table below (Figure 7), breaking down the numbers by territory/market.
While economic and earnings prospects look good, the market looks expensive. Back in January our equity view was overweight (“do not fight the bull market”), but we were measured in our return expectation (5% for 2021) to reflect valuations which were even higher than today (they have been brought down by c. 50% earnings growth in the US YTD). Since then, the market has continued on an inexorable upward trajectory, albeit with the baton changing hands from value to growth a few times.
The primary change in the past six months has been better-than-expected earnings and increasing earnings forecasts, which probably justifies the performance ahead of our more measured expectations.
So where to from here? In our view, the biggest drivers of the market are likely to be:
- The future change in earnings expectations: Expectations are now already high, after continual upward revisions for the past year and the risk is that, over the next six months, certain sectors might see earnings downgrades as life returns to normal and spikes in pent-up demand spending normalise.
- Inflation and the future course of the US Fed: Bond markets have thus far supported the Fed’s expectation that US inflation is transitory and the market will be watching closely. A low cost of money supports higher share valuations and conversely a change in this expectation will put pressure on share prices. We got a small taste of this in markets over a month ago.
- The path of the pandemic if things worsen materially again: In aggregate, we do not expect this, as global vaccine doses now exceed 3bn and the rollout globally continues at a pace of 40mn/day. However, we have learnt that the pandemic can surprise, and the road may be bumpy going forward.
- Other surprises? There are always numerous other potential sources for surprises, including Chinese aggression, other geopolitical risks, anti-trust regulation, and other regulatory moves.
After 15 months of almost uninterrupted upward momentum, the market feels comfortable, which can make investors complacent. With a positive macro picture, it seems likely to us that the short-term path will continue to be positive, but risks get higher as the market continues to move upwards.
We are not calling an end to the bull market at this point, but share selection becomes increasingly important at this stage of the market. We remain alert to the following at a level below the index:
- As overall index levels rise, we are conscious that certain shares become overvalued as overoptimism prevails, and the risk/return trade-off is just not attractive anymore. We seek to identify and avoid these, even if they are great companies.
- The world is going through unprecedented change and certain big technology-driven businesses are growing apace and their path of growth will be driven by their fundamentals rather than interest rates and macro moves. This is likely to be a major source of returns for some time to come.
- Opportunities remain in the reopening trade, where there are still counters trading at levels below that of early 2020.
- The banking sector still offers some value and an increase in rates will be positive for returns on bank capital and widen margins.
- There are always bottom-up opportunities, where the market is skeptical about a company we believe in and it is not pricing in the prospects – we actively seek these out.
- Chinese shares and, more specifically, Chinese tech companies, stand out as offering value relative to growth prospects. Government regulation has seen this sector come under pressure, but history shows these bouts of anxiety tend to fade and the market returns to valuing growth appropriately.
EMs have generally been far behind developed markets (DMs) from a vaccine perspective and COVID-19 might provide a drag on a relative basis. EMs are very commodity heavy and, given the SA weighting to commodities, our approach to EMs is to identify fast-growing quality businesses, which are exposed to the attractive demographics of their territories. There are some very exciting investments in these areas.
The US remains our choice destination for investment, especially given the technology-centric bias of that market compared to, for example, Europe. The latter, together with the UK, has a more industrial/banking/energy bias, which does offer positive shorter-term prospects.
GLOBAL BONDS
Global bonds have been one of the beneficiaries of the pandemic thanks to aggressive central bank efforts to maintain high levels of monetary support and liquidity throughout the crisis. While European and Japanese 10-year government bond yields are still anchored at around 0%, US yields are c. 0.4% below their pre-pandemic levels. With economic activity beginning to normalise, investors are laser-focussed on when and how the fiscal and monetary stimulus will reverse and how tightening liquidity conditions will impact generally stretched valuations for bonds (and stocks).
The EU and Japan do not appear to have an imminent inflation problem and it is likely that their central banks will be in less of a rush to rein in liquidity, so in this section we focus on the US’ response.
Our typical approach to forecasting US 10-year bond yields focusses on:
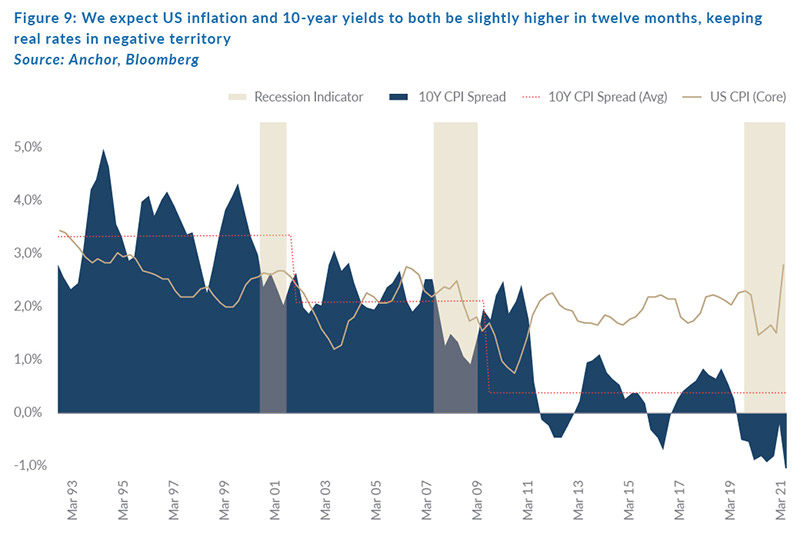
- Real yields: This requires some assumptions about the path of inflation and what impact quantitative easing (QE) will have on the prospects of investors earning positive real yields. We think inflation will still be experiencing some transitory impacts as well as the prospects of slightly higher shelter inflation towards the end of our forecast horizon. Regarding QE, we expect the Fed to start tapering its bond purchases early next year (with an increasing possibility that it may start sooner) and so, by the end of our forecast horizon, we expect tapering to be well underway. Despite the tapering, we think that real yields will remain negative over our forecast horizon, with both inflation and 10-year yields moving higher at a roughly similar quantum, albeit a slightly different pace. We expect real yields to turn positive only once inflation settles below 2% again and economic growth has enough momentum to sustain a shrinking Fed balance sheet (at least relative to currency in issue) – we do not believe either of those conditions will exist over the next twelve months.
- Term premium: Investors would typically expect a premium over short-term rates because of the uncertainty of lending money for such an extended period. Here, there are two components at play:
- Short-term rates – despite the Fed members becoming increasingly concerned about upside inflation surprises, even the most hawkish of them do not expect to start hiking rates before late 2022 (well past the forecast horizon which we are focussing on here).
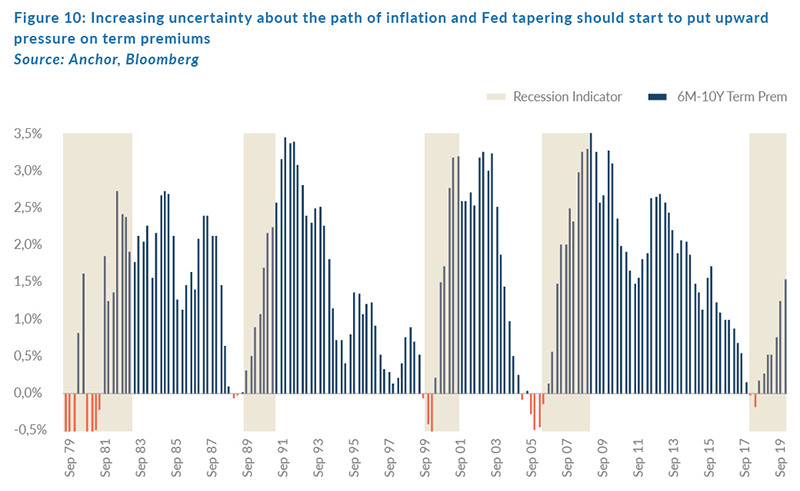
- Term premium – which the Fed has controlled via QE and investors have tended to not demand much of a term premium over the past decade because of extremely low inflation uncertainty/volatility and the Fed’s willingness to respond rapidly and aggressively to uncertainty with QE. With the prospect of higher uncertainty around inflation and the Fed beginning tapering over our forecast horizon, we expect upward pressure on term premium. This could be slightly offset by concerns around how tightening liquidity conditions might act as a headwind to growth. The term premium will be in relation to short-term rates which, even towards the end of our forecast horizon (in mid-2022), should still be very close to 0%.
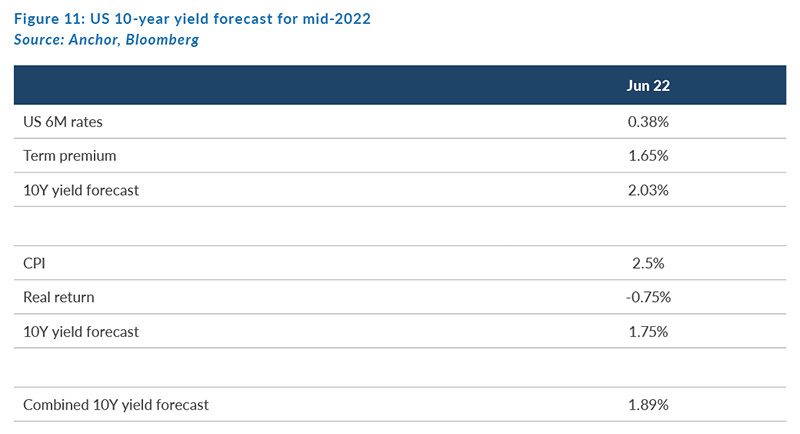
Combining the forecasts from the two approaches above, we expect US 10-year bond yields to be c. 1.9% by mid-2022. This will give investors a total return loss of about 2.3% in US dollar terms if they own those bonds for the next year.
Moving higher up the yield spectrum, towards US dollar investment-grade corporate bonds, we find ourselves in a familiar situation to most asset classes with credit spreads as tight as they have been in 25 years.
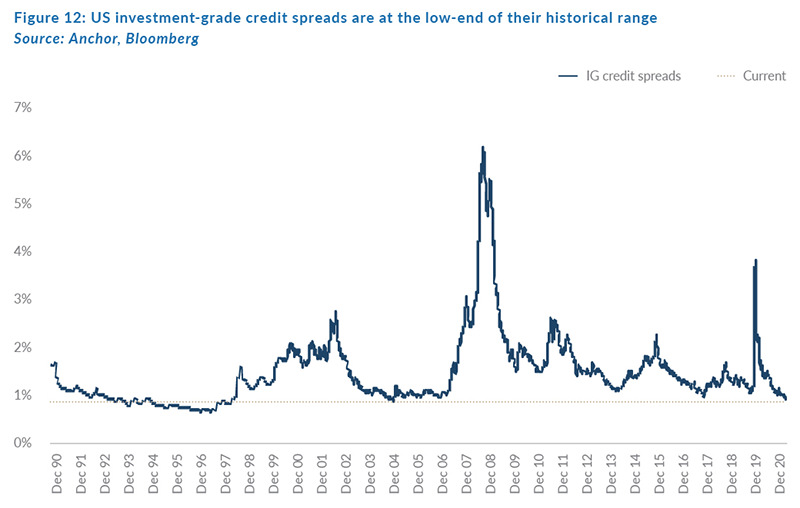
Despite seemingly stretched valuations, we find reasons to believe that credit spreads can maintain, or even improve, these levels over the next year.
- The central bank’s willingness to step in as a buyer of last resort in investment-grade corporate credit, should allow investors to feel more comfortable with the liquidity of this asset class. This is particularly so in an environment where post-global financial crisis (GFC) regulations have meant that banks are restricted in the role they historically fulfilled as a liquidity provider to the asset class.
- While credit spreads are stretched relative to the past 30 years, the current yield starved environment should see the “search for yield” provide an underpin to those levels.
- Yields have historically been able to settle at extremely tight levels for extended periods, particularly from early in an economic cycle, such as the one it appears we currently find ourselves in.
Based on the above factors, we see credit spreads tightening slightly over the next 12 months to 0.75%. With government yields backing up a little, that should leave US investment-grade corporate bonds trading at an aggregate yield of c. 2.45% by mid-2022, leaving investors in that asset class with a negative total return over the period of about 1%.
GLOBAL PROPERTY
Retail property has experienced a painful structural change over the course of the past decade as changing shopping behaviour has rendered large swathes of retail space redundant. Although US commercial real estate services and investment firm, CBRE suggests that the US still needs to shed up to 20% of additional retail real estate inventory by 2025, it is fair to say that the sector is already well down the path of reinventing itself and digesting excess supply.
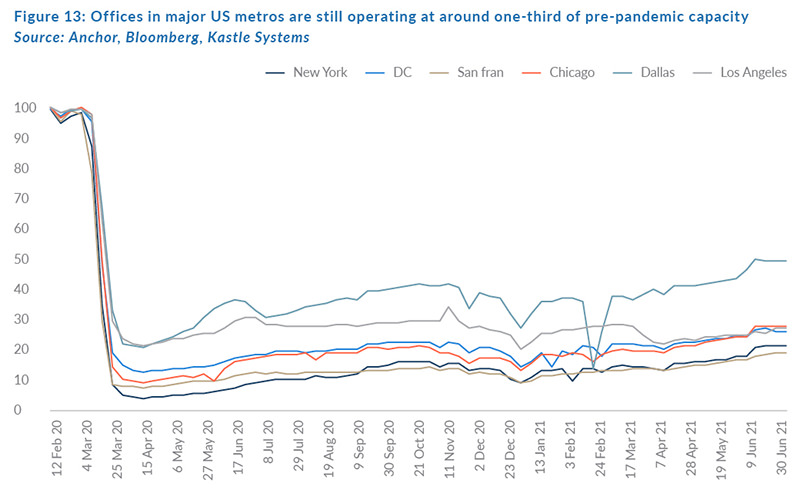
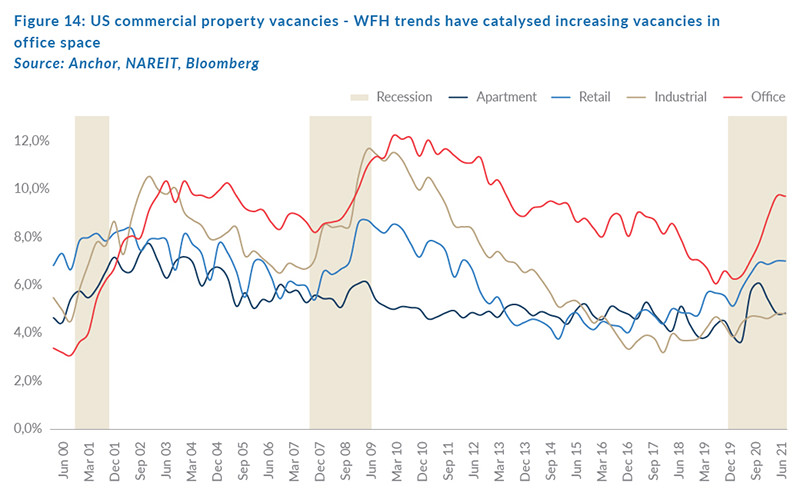
The pandemic has now thrust two new sectors into the spotlight of potential structural change – office and residential sectors (collectively about one-third of global real estate investment trusts’ [REITs] market cap) – as new work-from-home (WFH) trends have left office space with escalating vacancies and shrinking demand. Commercial real estate systems specialist, Kastle Systems, has aggregated data from office access systems of the c. 2,600 buildings it services across the US and the data suggest that most major metros are still seeing offices operating with less than one-third of their staff being physically present.
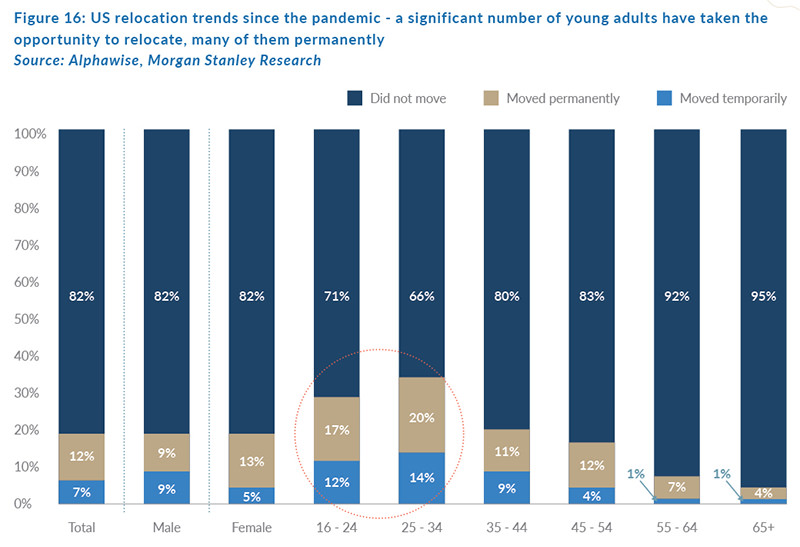
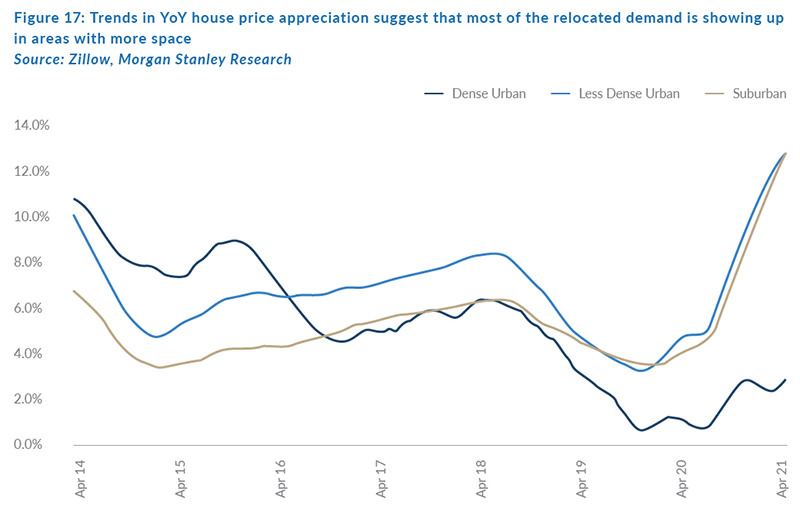
While WFH has put office space under pressure it has also increased demand for residential space as younger adults, in particular, look for larger living spaces in suburban and less densely populated urban areas.
We expect growth in retail property income to remain somewhat muted for the foreseeable future, while the trends in WFH should have a roughly offsetting impact in office and residential property income growth. Those three sectors account for around half of global REIT market cap and, in aggregate, should be largely ex-growth over our twelve-month forecast horizon. The remaining half of market cap is dominated by industrial and specialised REITs, which are likely to continue to see growth in demand, albeit being increasing met by accelerating supply. So, at the industry level, we expect an aggregate growth of rental income in the low-single digits.
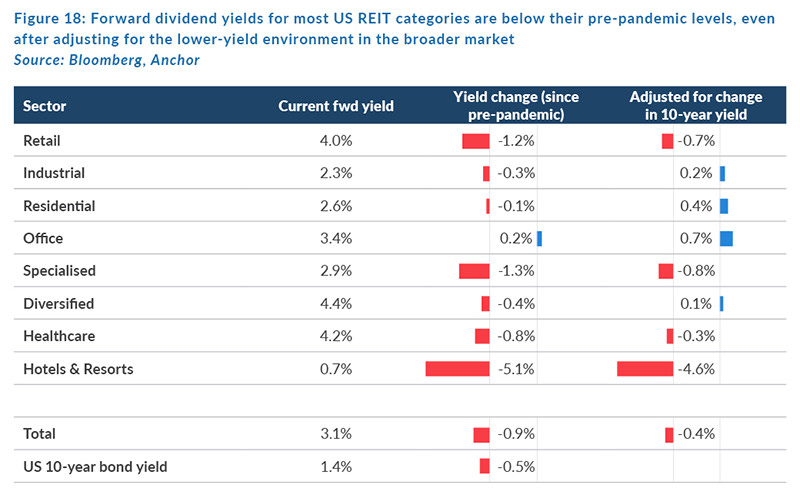
With REITs already below their pre-pandemic levels (even after adjusting for the lower-yield environment), we see limited prospects for a re-rating in the sector at the aggregate level.
The net impact is likely to be a total return for investors in global listed property of about 5% over the next 12 months, with 60% of that in the form of yield and the rest from income growth.