ASSET ALLOCATION SUMMARY
The following table illustrates our house view on different asset classes. This view is based on our estimate of the risk and return properties of each asset class in question. As individual Anchor portfolios have specific strategies and distinct risk profiles, they may differ from the more generic house view illustrated here.
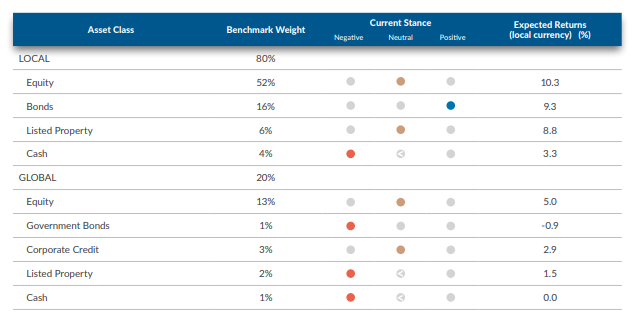
The range of possible outcomes for the various asset classes is particularly wide at present and it is also highly dependent on your outlook for the different scenarios. We have decided to display the possible outcomes as a series of tables and charts below. Anchor’s base case is somewhere between a scenario of recovering from the pandemic by year-end, or the global economy bumbling along for several years, while this plays out.
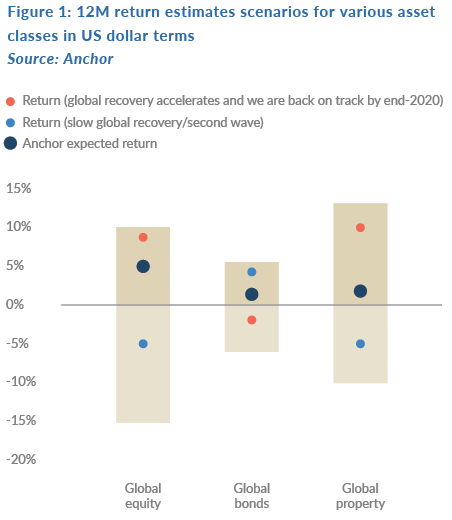
In Figure 1, we highlight the US dollar return outlook for the various global asset classes. The bars in Figure 1 represent the reasonable range of possible outcomes, with the dots representing our estimate of what the outcome will be in the different scenarios. From a global perspective, equity is the most attractive asset class if you do not expect the global economy to plunge into a second recession.
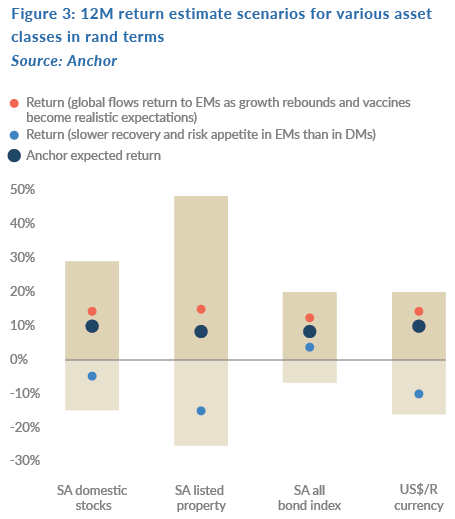
In SA, the range of possible outcomes is even wider given that much depends on both the extent of government’s structural reform and the behaviour of the global pandemic.
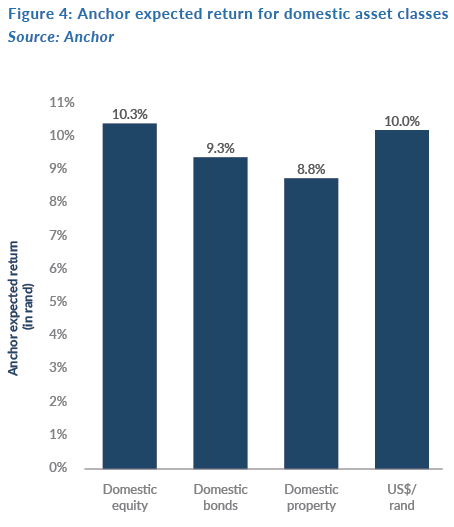
In Figure 3 below, we highlight the rand return outlook for several asset classes. The bars represent the reasonable range of possible outcomes, with the dots representing our estimate of what the outcome will be under the various scenarios. From a domestic investor perspective, bonds are the most attractive asset class on a risk-adjusted basis, but we should also not ignore local equity.
STRATEGY AND ASSET ALLOCATION
The COVID-19 pandemic has, without a doubt, delivered an enormous shock to the global economy. Lockdowns and other restrictions necessary to address the public health crisis, together with reductions in economic activity by consumers and producers alike, has led to a combination of adverse shocks that is causing deep recessions in many developed market (DM) and emerging market (EM) economies. As it stands, financial markets are in two minds. On the one side, the global economy appears to be hitting the start of a recovery, notably led by China and Europe. This is largely being driven by the increased relaxation of social distancing measures in order to reopen economies, along with record levels of monetary and fiscal stimulus released by central banks and governments across the globe.
On the other side, investors remain rattled as concerns rise surrounding the rapidly increasing COVID-19 infections in EMs, and the possibility of a second wave of infections in the US and China. Furthermore, global tensions are on the rise, amid ongoing (and quickly escalating) trade frictions between the US, China, and Europe as well as land disputes between China and India, and China’s recent passing of controversial security legislation for Hong Kong.
As global investors began to realise the magnitude of the pandemic in March, they pulled funds from EMs and put their money in safe-haven investments. EM portfolio outflows during this crisis dwarfed the levels seen during the global financial crisis (GFC). Fortunately, portfolio outflows from EMs were short-lived this time around. The world’s largest central banks, such as the US Federal Reserve (Fed), injected huge sums of liquidity into financial markets, which spilled into EMs. Some EMs were even able to raise funds in international capital markets, with more than US$83bn of bond issuances since April.
Domestically, the pressure in SA continues to ramp up. National Treasury expects tax revenue to undershoot February’s budget estimate by more than R300bn this fiscal year. Coupled with unforeseen health and income support expenditures (and the fact that SA’s public finances were already on an unsustainable path before the shock), a record consolidated budget deficit amounting to 15.7% of GDP is now expected for 2020/2021. With an annualised 1Q20 GDP contraction of 2.0% QoQ, following QoQ declines of 0.8% and 1.4% in 3Q19 and 4Q19, respectively, and a current unemployment rate of 30.1% SA’s road ahead will be tough. Medium-term fiscal frugality is imperative, with Finance Minister Tito Mboweni emphasising in his June Supplementary Budget speech that, if SA fails to deliver on growth reforms and does not manage to consolidate its public debt, a sovereign debt crisis looms in the next four to five years.
Whilst the COVID-19 pandemic has triggered the deepest global recession in decades, the ultimate outcome is uncertain. It is this dichotomy, between a weak global economy and a buoyant financial economy spurred on by central bank support, which makes investing difficult at present. The old adage of ‘don’t fight the Fed’ (meaning you should invest in a way that aligns with the Fed’s current monetary policies rather than against it) is particularly poignant yet, ultimately, the value of an investment is driven by its future income generation capacity. Whilst volatility will remain high for the foreseeable future, opportunities continue to exist throughout most asset classes.
SA equity
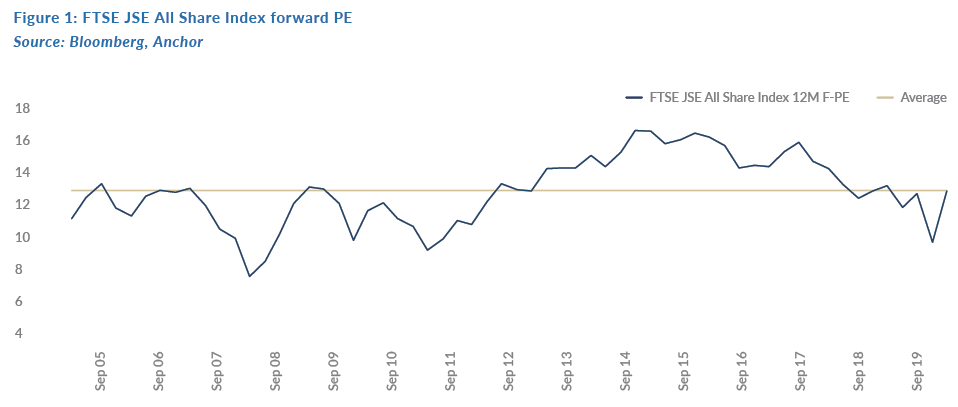
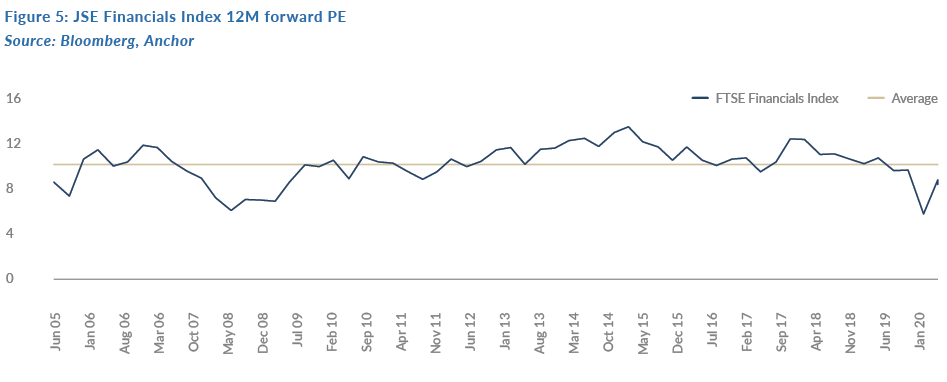
In 2Q20, SA equities recorded their best quarterly return since 2000, delivering a total return of 22.6%. However, this optically great return should be seen in the context of a very poor 1Q20, where the FTSE/JSE Capped Swix Index ended the quarter 26.3% lower as SA followed the rest of the world into a hard lockdown to curb the spread of the COVID-19 pandemic. The bounce in equities off their March lows, leaves the YTD Capped Swix equity return at a negative 10.6% and, using its sister benchmark, the FTSE JSE All Share Index, which has a longer history, the JSE is on a 12-month forward PE of c. 12x – broadly in line with the average of the past 15 years:
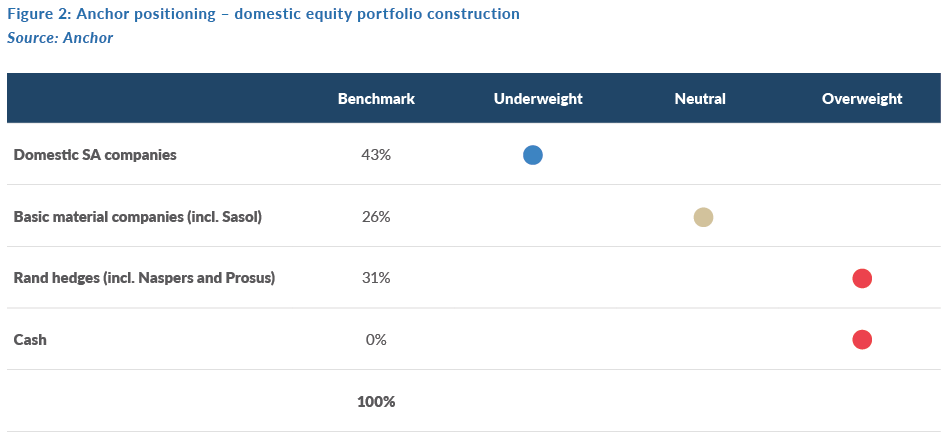
Overall, positioning for the Anchor equity research process has remained defensive, with a clear bias towards those companies that are less reliant on the SA economy for growth, the so-called rand-hedge shares, and exporters such as basic materials companies. In terms of our allocation to domestically focused businesses, we have a clear bias towards those businesses with strong market position, proven management teams and balance sheets that should be able to withstand the external shock which our economy is currently experiencing. We have used the increase in global risk appetite to further de-risk portfolios where we believe the share prices have possibly moved ahead of fundamentals.
The range of possible outcomes is particularly wide, however, we set out the base case of our forecast below.
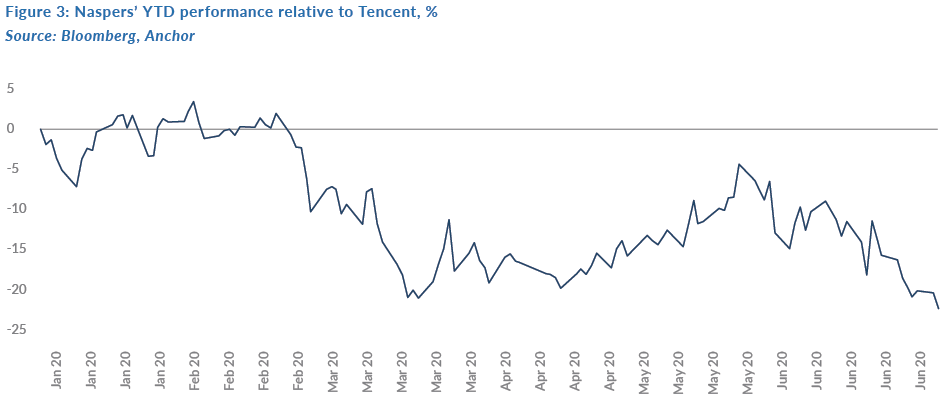
As a result of the domestic economy’s many years of underperformance, the local equity index has become increasingly concentrated in fewer businesses, most of which are reliant on growth vectors beyond our borders. To date, Naspers (and now investment company, Prosus) still commands a dominant position in most SA equity portfolios. Their key investment, China’s Tencent, is seemingly shielded, if not a direct beneficiary of the lockdown measures brought about by the global pandemic, as its core gaming business saw a sharp increase in user engagement during 1Q20. Disappointingly, 1H20 was again a period where investors would have been better off owning Tencent directly as Naspers underperformed Tencent by a full 22%.
It is positive for Prosus and, by default, Naspers, that the three key verticals these two companies have exposure to outside of Tencent, i.e. online classifieds, food delivery and financial technology (fintech), have also experienced a step change in user engagement as a result of the pandemic. We are optimistic that market conditions are right for the large discount, at which Prosus trades relative to Tencent, to narrow materially.
Resources
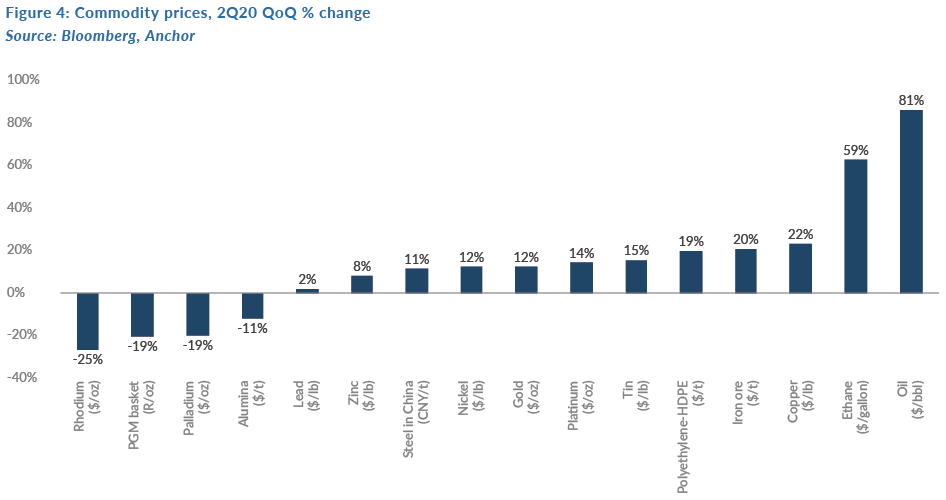
The resources sector had a very strong 2Q20. Growth-sensitive commodities such as Brent Crude oil, copper and iron ore rallied 81%, 22% and 20% QoQ, respectively (see Figure 4), as risk sentiment returned in a meaningful way. Share prices followed suit. Sasol was by far the sector’s star performer, rising by 258% from its March battered lows. Shares of precious metals miners rose c. 60%-80%. In the case of gold, a 14% rise in the gold price had a material effect on earnings expectations, given the substantial operating leverage in gold mining businesses. Although the platinum group metal (PGM) basket price declined by 19% in rand terms, significant supply issues due to Anglo American Platinum’s (Amplats’) force majeure declaration and lower mined production from the sector due to the lockdown, improved sentiment and helped mitigate against much weaker demand. However, paper and packaging companies, Sappi, and Mondi, lagged the wider sector as pulp and packaging prices remained muted.
We expect the resources sector to have its strongest earnings growth in the precious metals complex, thanks to the PGM basket and the gold price rising by 40% and 45% YTD, respectively, in rand terms. Within the diversified mining sector, we expect miners with exposure to iron ore and PGMs to grow their earnings faster than those without that exposure. However, earnings growth for diversified miners, that primarily rely on base metal prices, is expected to remain muted.
Global growth and commodity supply remain key risk factors. Commodities such as iron ore and palladium have been helped by supply growth being weaker than expected. Iron ore output issues from Brazil and PGM supply issues from SA have helped to mitigate the sharp decline in growth that occurred in 2Q20 due to COVID-19. A V-shaped recovery in global growth, coupled with continued supply disruptions, would be ideal for the sector. Conversely, muted growth and a strong rebound in supply would be very bearish, with the key unknown being potential infrastructure-led stimulus measures from China, which could be the dark horse that keeps base metals, such as iron ore, elevated for longer than analysts are forecasting.
Domestic companies
Turning to the domestically focussed companies, we start off by conceding that the range of potential outcomes is wider than at any point in living memory. Going into the previous deep recession (the 2008 GFC), SA was in a far stronger fiscal position, than the country currently finds itself in, and austerity at a time when spending should be stimulating growth seems to be the only option. In our view, and by our measures, the real “South African” equities peaked sometime between 2014 and 2015, with most domestically focussed companies having to deal with recessionary type conditions since then. It has been a frustrating period for the Anchor investment process, made up of individual stock pickers, who for the most part, have not been able to identify a broad set of domestically focused companies with sustainable/structural growth tailwinds. We are incrementally more positive on the current leadership of President Cyril Ramaphosa relative to the previous administration of ex-President Jacob Zuma. However, change has been too slow to get the economic flywheel turning and, unfortunately, the economic onslaught of COVID-19 could not have come at a worse time for the country.
It therefore comes as no surprise that domestically focussed shares have performed poorly in 2020, with outcomes ranging from several corporate failures to less dramatic 20% drawdowns in equity values. Despite the large drawdowns in equity values, on a PE basis, these shares do not screen as overly cheap due to the expectations of future earnings having been pulled back an equivalent amount to the share price drawdowns.
Given current operating conditions, it is difficult to see SA corporate earnings beating these expectations, especially considering the economic constraints companies are facing.
However, it should be noted that the bad news is not new news. South Africans get very frustrated as they are continuously bombarded with negative news, but a key lesson from the past six months is that equity markets are forward looking and often bottom before the bad news does. Up until about five years ago, SA had always punched above its weight in the global economy. Great local businesses were built by gold-standard entrepreneurs, with many business models successfully externalised (and admittedly some less so, see our article below entitled, SA corporates’ offshore forays have destroyed over R300bn in value). The big optionality for JSE investors is likely in the domestically focussed names, like best-of-breed banks, insurers, retailers, and industrials, which would likely see aggressive positive earnings revisions on any signs of sustainable economic growth.
Our chosen approach is to position ourselves for the environment we are currently experiencing, without the desire to make any bold predictions on when SA will return to long-run productivity. As a result, we are underweight SA, with the exposure we have biased towards those companies that display our key philosophical pillars of free cash flow, a strong balance sheet, best-in-class management, and disciplined capital allocation.
SA property
Because of the COVID-19 pandemic, SA went into a hard lockdown at the start of 2Q20. The SA listed property market had anticipated some of the pain that this would cause, with the sector having fallen by 48% in 1Q20. While volatility has been the order of the day in 2Q20, the listed property sector has bounced off its lows to record a c. 21% gain for the second quarter.
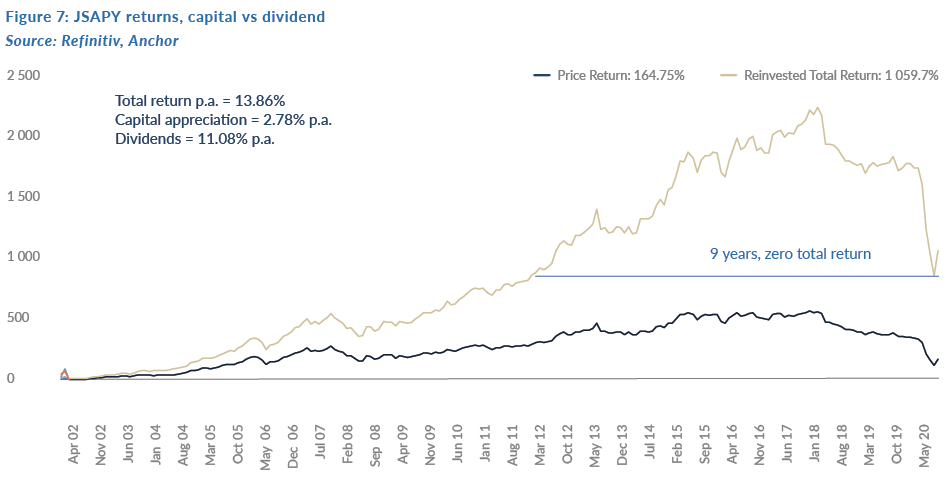
Looking at the longer-term historic performance of the JSE Listed Property Index (JSAPY), we highlight that, since April 2002 when the new FTSE JSE indices were launched, the JSAPY’s total return is an impressive 13.9% p.a. (up to the end of May 2020). However, such has been the veracity of share price declines since 2017 and particularly this year, that any investor who had been invested in the listed property market for less than nine years has experienced a negative total return.
The current state of play in the property sector, largely due to the pandemic, is that tenants remain under significant pressures, which property companies could not have mitigated against. This, in turn, has meant that rental collections by landlords have been negatively impacted, sometimes severely.
This has been the case especially in the local retail property sector which, for a long time (20-plus years), had an uninterrupted sweet spot because of rental growth.
However, in the space of only a few months, all property companies’ income and distribution guidance are off the table. Forecast risk has never been higher, leading to incredible volatility in listed property shares. As a sector, property is now more volatile than resources, which was once seen as the ultimate cyclical equity segment.
In a trading update, SA’s largest real estate investment trust (REIT), and the only property counter remaining in the FTSE JSE All Share Index (ALSI) of top-40 stocks, Growthpoint Group CEO Norbert Sasse commented that property valuations could fall by between 10% and 20%, with 80% of this drop being caused by income statement pressures and only 20% by capitalisation (cap) rates rising. This means that distributable incomes from property shares could fall by 10%–15% YoY and loan-to-value (LTV) ratios could reach uncomfortable levels across the industry and, in some instances, even breach covenants.
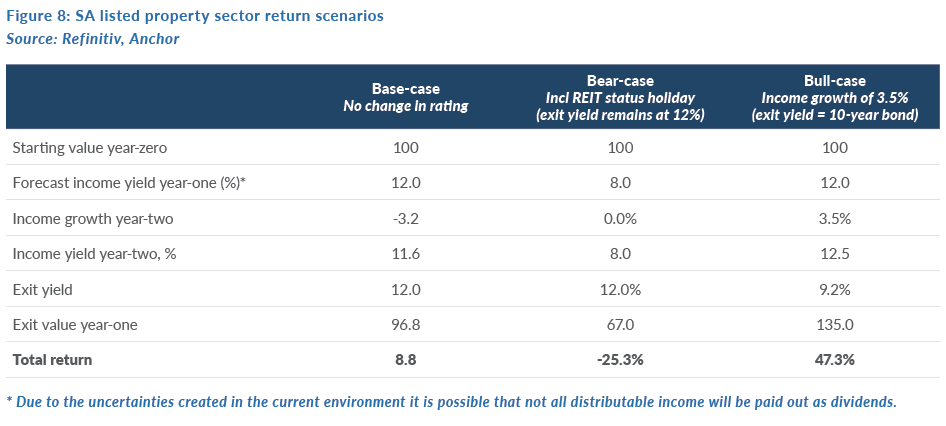
Forecasting property sector returns therefore results in a wide range of possible scenarios. Figure 8 below highlights these sensitivities, with our base-case scenario being a return of c. 9% for a 12-month period. This reflects negative distributable income and yield growth of 3%, using the current yield of 12% as the cap rate valuation. Our bear-case scenario assumes a further fall in distributable income, partly as a result of a possible REIT status 75% pay-out ratio holiday, while our bull-case scenario assumes some normality returning and investors being willing to value property assets at the current 10-year bond rate.
We highlight that current listed property share prices already reflect deep discounts to their net asset values (NAVs). Property companies that went into this crisis with reasonably strong balance sheets and manageable debt levels, and can weather the storm, will provide investors with good returns. However, the journey to that destination will need seatbelts fastened throughout!
SA bonds
2Q20 followed on from a dramatic 1Q20, when the COVID-19 pandemic hit globally in March, pushing asset classes around the world into periods of high volatility. Subsequently, as the pandemic spread globally a more measured approach has been witnessed, as governments attempt to deal with the crisis in any manner possible.
In SA, this has taken the shape of a combination of strong rate cuts (the SA Reserve Bank [SARB] has cut the repo rate by 275 bpts YTD), a governmental intervention package (including support for certain sectors), and a business rescue package (pulled from private donors).
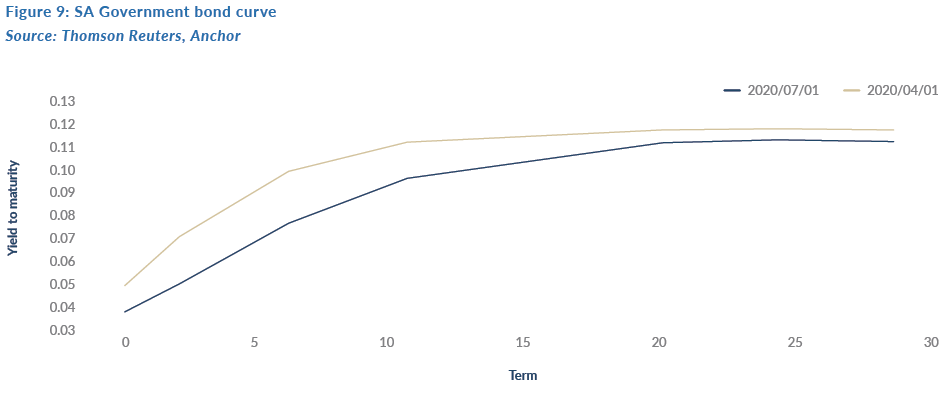
The SA bond curve has shifted subtly over the quarter – with the long end remaining at elevated levels, while the continued SARB rate cuts have pegged the short end lower.
June’s Supplementary Budget indicated a much riskier fiscal position than before. With intervention strongly required to prevent debt/GDP levels soaring to over 100% in the short-to medium term. The finance minister has also been consistent on the message of fiscal discipline. However, one must apply caution given the SA government’s spendthrift history.
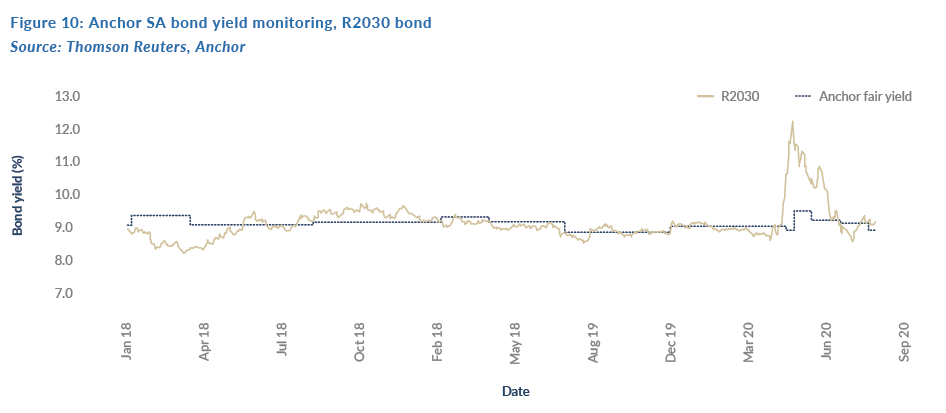
In Figure 10 above, we track the R2030 vs our modelled fair yield. In late-March 2020, the COVID-19 induced spike is evident. Subsequently, however, the bond has traded back to within the range of our fair yield. We expect yields to be relatively consistent, absent any major destabilising political news. Recent economic data (for example the balance of trade, which printed positively for the first time in 17 years), suggest that the impact of the pandemic has not yet been fully realised.
Going forward, our base expectation is for SA government bonds (SAGBs) to remain range bound, with the shorter-term bonds (R2023) being tied to SARB rate expectations and realised cuts, while the longer bonds (over R2030, a 10-year plus term) will be pegged to National Treasury announcements. Our base view is for the R186 to drift lower in yield, as it moves from being a “belly” bond to being a “short-term” bond. Further, we expect the R2030 to become standardised as the benchmark bond over the next 6-18 months. This should make it trade in tighter ranges, as it will become the most liquid of the SAGBs.
While yields present at less attractive levels than at the height of the pandemic, when 10-year debt could be purchased yielding 13%, current levels are still above fair and, to this end, we continue to believe that duration assets remain attractive from a yield perspective. This is particularly so considering the repeated SARB rate cuts which bring the JIBAR rate lower, and thus makes floating rates and short-dated debt less attractive.
Rand
Projecting the rand’s value in a year’s time is a fool’s errand. The rand vs US dollar exchange rate is one of the world’s most volatile currency pairs and trades well away from any modelled fair value for long periods. We note though that in most 12-month periods the rand trades within a R2.50 range to the dollar. However, 1H20 was far from normal and we saw the rand set a new weakest-level record of R19.35/US$1 at the height of the COVID-19 crisis.
We maintain our view that, while the rand should trade on the weaker side of fair, it is oversold at current levels and therefore as the world recovers from this crisis, we see scope for the local currency to claw back more of its losses. Nevertheless, we think that this will be a slow process and that, for now, the rand will remain range bound in a volatile environment. As with all asset classes, the near-term outlook for the COVID-19 crisis also dictates the near-term outlook for the rand.
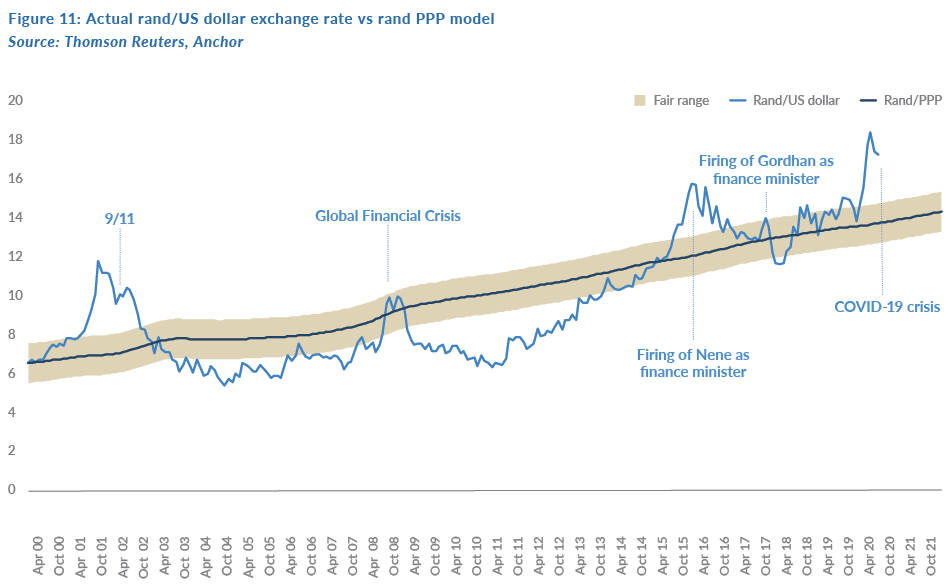
We retain our purchasing power parity (PPP) based model for estimating the fair value of the rand and we have extended this out by three months since the publication of our 2Q20 Navigator report on 9 April 2020. Our PPP-modelled value for the rand vs US dollar at the end of the next 12 months is R14.27/$1 (see Figure 11). We apply a R2.00 range around this to get to a fair value range of between R13.27/$1 and R15.27/$1.
We expect the rand to remain particularly volatile and on the weaker side of our fair range band. This would imply that we see scope for up to a 10% strengthening from the rand’s current levels as the world recovers.
Global equity
Our team has seldom debated future global equity returns more vigorously than in recent weeks. A 19% decline in the S&P 500 in 1Q20 was followed by a 19% rise in 2Q20, leaving the US market down a few percentage points from the beginning of this year. The world economy has to recover strongly to justify the recent recovery in the market.
However, there is no playbook for current market conditions and sentiment regarding the ultimate 12- to 24-month impact of COVID-19 changes every day, as infections take different directions around the globe. At this stage, the world is opening up, but infections are still increasing. Markets are taking comfort in the strong slowdown of infections in Europe, but this has yet to be replicated in the US and many other EMs.
Global equity markets posted their third-straight positive monthly performance in June to end 2Q20 on a strong footing. DMs had their best quarter (MSCI World +19.4%) since 2Q09, while the S&P 500 Index recorded its best quarter (+20.5%) since 4Q98.
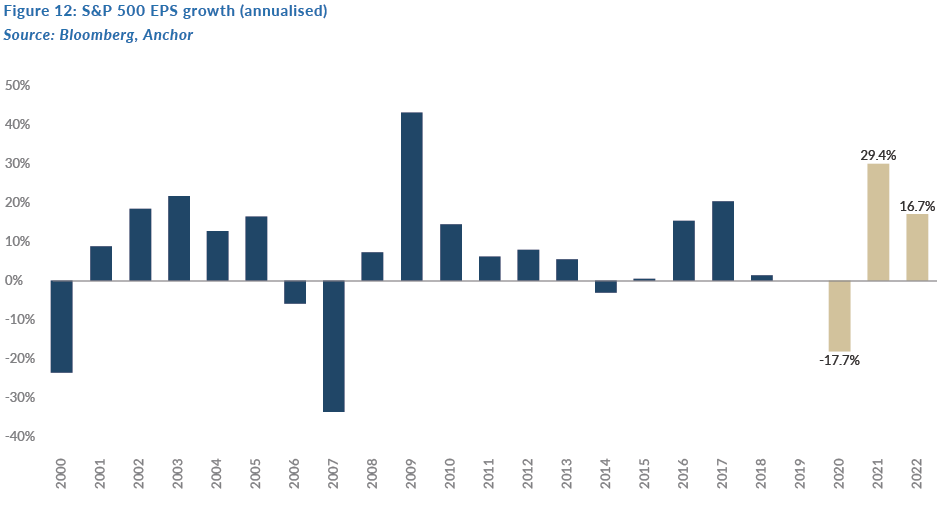
Not surprisingly, company earnings took a dive in 1H20 and US S&P 500 earnings are projected to decline by 18.4% this year (see Figure 12). A good example of the impact of the lockdown is one of our highest quality holdings, Nike, which saw sales decline 36% YoY in the three months to May and this resulted in a loss of US$790mn (the Group reported just under US$1bn in profit for the prior three-month period). The Nike share price has already recovered back to pre-pandemic levels. Market consensus is for a sharp recovery in overall US earnings in 2021, but this is by no means a certainty.
The pandemic has changed the prospects of many companies – unemployment is higher (but improving sharply), tech trends have accelerated, resource company prospects have improved as infrastructure stimulus will follow. Meanwhile, companies that rely on travel and tourism will be severely impacted for some time to come. Sectoral performances have been starkly different, and the tech-heavy Nasdaq 100 Index is now 16.9% higher YTD – a full 20% ahead of the S&P 500 Index.
So, at an index level the market looks less attractive on a risk/return basis, but one must look one level lower to reach firmer conclusions. There are numerous shares and sectors which are still down materially from their highs and, if the economy is going to recover quickly, opportunities still exist to take advantage of current market pricing.
Figure 13 below shows the MSCI Index forward PE (23x), which highlights the impact that the decline in earnings has had on valuations.
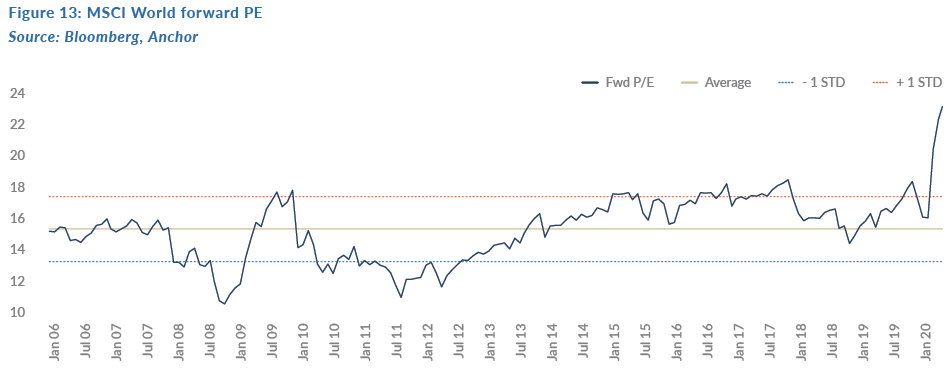
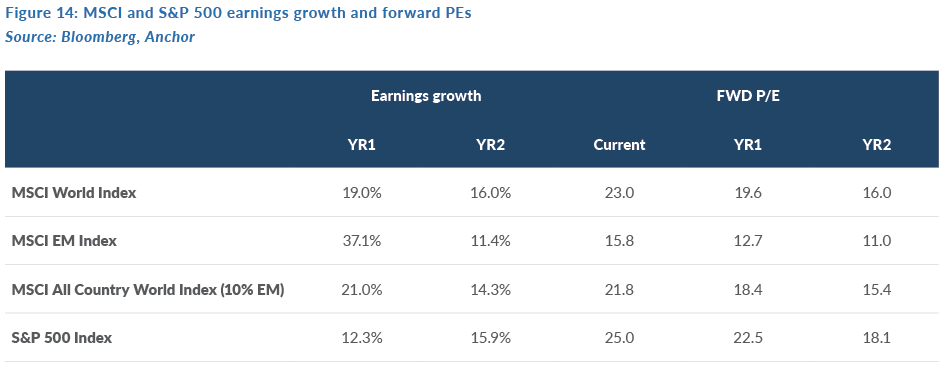
The usefulness of Figure 13 above is limited in current conditions as an indicator of future returns, but as can be seen in Figure 14, the one-year (19.6x) and two-year (16x) forward PEs are still in expensive territory. The market is pricing in the recovery.
While earnings and valuations do not, in aggregate, suggest a compelling equity outlook, one cannot ignore the impact of the global stimulus packages (especially in the US). This has no doubt been the most significant factor behind the market recovery and we think this trend and support will continue. The cost of money will be very low for a long time to come and there are few alternatives to equities in the pursuit of meaningful returns. Investors have to take some risk to have the prospect of returns.
Our equity approach is as follows:
- Retain a core portfolio of high-quality growth shares, which we believe will be higher in 12 months’ time, with more volatility expected.
- Recognise the risk of a further correction, given the straight line upwards from the bottom. We are keeping an above average level of cash in equity portfolios to take advantage of price opportunities.
- Take selected advantage of recovery shares, which are still well below their highs – some examples include Sysco, Synchrony and JP Morgan.
- Ensure we have sufficient exposure to the optionality in technology-driven companies, whose futures have become even more exciting.
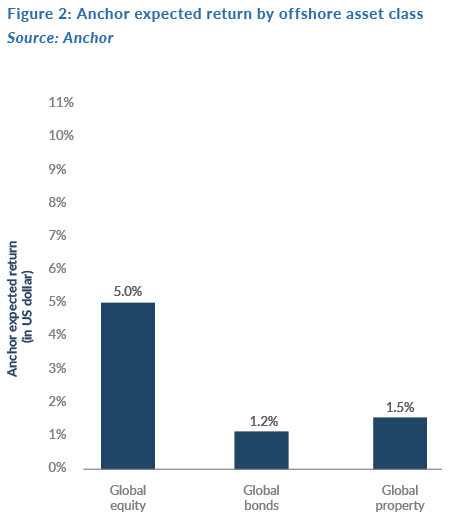
Our one-year projected return on global equities is 5%. Our bear-case scenario is a negative 15% and the bull case is a 10% return.
Global property
Some sectors of the commercial real estate market entered the COVID-19 crisis already suffering from the structural challenges of a shift to a more online world. COVD-19 has exacerbated these trends and created additional challenges for other sectors, particularly for hotel and resort REITs and healthcare REITs, which have a high exposure to senior housing. Dividend expectations have come down by c. 27% YTD as REITs have cut dividends to shore up their balance sheets. This has been felt most acutely in the troubled retail REIT sector, where dividend expectations have dropped by almost 50%, while the new work-from-home phenomenon has brought into question what the requirements will be for office space going forward. In addition, a huge spike in unemployment rates has put pressure on the residential housing sector.
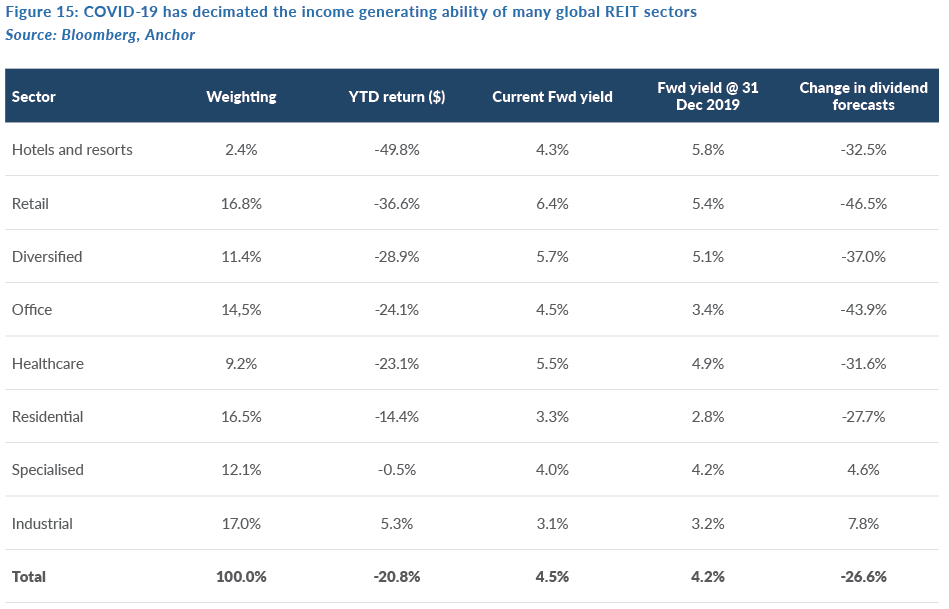
Commercial mortgage-backed securities (CMBS) are pricing-in the expectation of at least 15% defaults, while spreads between US government bond yields and REIT dividend yields are now at their highest levels since the GFC, reflecting continued uncertainty for the sector. As with the equity market, where there has been a bifurcation between businesses geared towards the online and offline sectors, REITs have been no exception with industrial and specialised REITs, particularly those focused on logistics for online retail and those supporting the cloud and other online initiatives, benefitting at the expense of the offline economy. We expect that, as lower rental reversions, additional vacancies and bad debts pile up over the course of the next twelve months, dividend expectations are likely to fall further, thus offsetting the majority of the sector’s dividend yields to leave investors with a total return of around 1.5% for the year.
Global bonds
The end of our one-year forecast horizon is likely to coincide with the rollout of a possible COVID-19 vaccine, or at least reasonably advanced vaccine trials, which should hopefully accelerate the normalisation of economic activity. This is also likely to result in a normalisation of inflation, with forecasters expecting US inflation to reach 1.8% by 2Q21. Our US 10-year bond forecasts combine real-rate expectations with term-premium expectations. In a QE-centric world, we tend to apply higher credence to the term-premium based approach and, as such, we expect US 10-year government bond yields to have negative real yields even once inflation starts to normalise one-year out as the Fed will have to act cautiously in unwinding QE in a post-COVID, debt-soaked world.
On a probability weighted basis, we expect US 10-year bond yields to reach 0.8% by the end of 2Q21, leaving investors in US 10-year government bonds with a 0.6% total return loss over the next twelve months. For US corporate bonds, we see the Fed’s corporate bond purchasing programme and the search for yield as slightly offsetting the potential drag from higher corporate defaults. This should leave US investment-grade corporate bond credit spreads slightly lower one-year out (at 1.2%), giving investors in US investment-grade corporate bonds a total return over the next twelve months of around 2.9%.