ECONOMICS
As the world cautiously strides into 2021, global economic data remain largely positive with growth continuing to recover despite the return of global COVID-19 restrictions as infection rates rise sharply and a more virulent strain of the virus spreads. After the first wave of the COVID-19 pandemic hit in early 2020, triggering a collapse in global economies and financial markets alike, central banks across the globe responded by rolling-out unparalleled levels of stimulus measures. These measures have primarily, along with the start of vaccine programmes in many countries, kept the risk-on sentiment buoyant, supported by the adoption of the much-delayed US$900bn stimulus package in the US and the finalisation of a post-Brexit UK/EU agreement. Whilst the renewed vaccine optimism appears to have offset concerns surrounding the further escalation in coronavirus cases globally, given the severe nature of the pandemic (particularly in the US and throughout Europe) as well as the many job losses accompanying these tragic deaths, overall a high degree of caution is still warranted.
Overall, the forecast staggered recovery process will prevent a significant pickup in global demand and limit the extent of global inflation pressures until vaccines are widely distributed. On the face of it, we expect that much of the developed world will be vaccinated by the end of 2Q21, with many emerging markets (EMs) vaccinated by the end of 3Q21. SA’s vaccine plan appears to be gaining shape and we expect that we will also fall within those timelines. Weakness in global economic demand, against an already low inflation backdrop, continues to provide governments and central banks with space to further support their economies. Whilst this global backdrop offers relatively favourable conditions for ongoing fiscal and monetary policy assistance, the economic risks necessitating this will continue to boost safe-haven assets. We think that the vaccines and ongoing recovery will slow down the amount of stimulus being provided and that the peak stimulus will be in 1Q21. Downside risks include rising global indebtedness, oil market volatility, US-China tensions, nationalistic politics and policies, anti-globalisation sentiment and stagflationary- like macroeconomic outcomes.
Locally, SA’s investment landscape in 1Q21 will largely be dominated by concerns surrounding the surges in COVID-19 infections following the festive/holiday season. At the end of December 2020, President Cyril Ramaphosa announced restrictions (both national and regional) aimed at curbing the second wave amid a severe strain on the national health sector. Though necessary, these measures will further dampen the local economic recovery, particularly since there cannot be any certainty that tighter restrictions or further rounds of restrictions can be avoided ahead of the arrival of widespread access to vaccines. Thus, financial markets have largely shifted their attention to the impact that the adjusted level 3 lockdown, and now further load shedding, will have on the already battered economy, particularly since vaccines are unlikely to be widely accessible in SA before 2Q21.
Furthermore, the relatively large scale of social support provided in 2020 leaves the country with one of the fastest-growing debt burdens among EM sovereigns. SA’s fiscal and consequent debt sustainability woes remain significant concerns, prompting both Moody’s and Fitch to downgrade the country’s sovereign credit ratings on 20 November 2020. Nevertheless, SA government debt has been attracting foreign buyers given its relatively high real yield. Moving into 2021, the famous quote “Uncertainty is the only certainty there is, and knowing how to live with insecurity is the only security” by John Allen Paulos indeed holds true. This uncertainty will permeate the local economic outlook in 1Q21. Still, we anticipate some form of economic recovery in 2021. The extent of such a recovery remains uncertain and depends on the factors mentioned above, however, the point is that 2021 should be better than last year for the domestic economy.
SA EQUITY
Over the last two months of 2020, the JSE’s domestically focussed component finally broke out of the range in which it has been since March 2020’s pandemic-induced market downturn. Reports around the positive efficacy of COVID-19 vaccine candidates, kicked off the biggest one-day rotation out of growth and into value stocks that markets have ever produced. EMs were the biggest beneficiaries of this increased risk appetite and SA was no exception – from 1 November to 31 December 2020 the FTSE JSE Capped Swix outperformed the S&P 500 by a convincing 14%.
But does this recent rally in SA assets have further to go heading into 2021? With much uncertainty around a return to some type of new “normalised” social and economic life, making bold financial projections is fraught with high forecast risk due to continuously evolving global economic developments. In SA, this is exacerbated by the country’s fragile economic position prior to the pandemic. The main reasons we are constructive on SA equities in 2021, have little to do with bottom-up, company specific drivers and are instead premised on higher-level, macro-orientated drivers including:
- Global economic conditions gradually improving and the vaccine rollout resulting in society returning towards some semblance of normality.
- Conventional economic wisdom suggests equities perform best at times of loose monetary and fiscal policy and central banks and government-led stimulus measures should underpin lower real rates and higher equity valuations for the foreseeable future.
- The US Presidential Election has provided some stability to the global geopolitical outlook and greater certainty here should comfort investors to deploy capital into riskier assets with the key beneficiary being EM equities.
While a global economic recovery, fuelled by loose monetary and fiscal policy, underpins our positive view on EM equities, tying this into a constructive view on local equities requires a further look at some core themes that could play out in various components of the JSE this year including:
- A Naspers and Prosus value unlock to narrow the gaping discount to the underlying sum of the parts these shares have been trading at for some time.
- Basic materials (accounting for c. one-third of the FTSE JSE Capped Swix Index), has been a recent outperformer relative to companies more reliant on domestic economic growth.
- Larger, more diversified mining businesses are pricing in commodity prices well below prevailing spot prices and, with cleaner balance sheets and clearer communication around capital allocation, we expect significant upside to these companies’ earnings.
- Domestically focussed stocks benefit most from economic recovery and higher EM flows, particularly more liquid sectors such as banks, insurance, and retail.
- We expect a sharp recovery in earnings over the short term, specifically in consumer-facing sectors shut down at the peak of the lockdowns, but a sustained earnings recovery will require a determined effort from policymakers to i) conduct an effective COVID-19 vaccine rollout; and ii) enact key structural reforms.
- Over the past two months, the market has given a V-shaped local economic recovery the benefit of the doubt, with a healthy rerating of larger, more liquid, local counters implying a sharp recovery in 2021 activity levels.
Our SA equities base case is a c. 11% expected return for 2021, although getting the allocation right below the index level will be a key determinant of success.
SA PROPERTY
It would be easy to dwell on the negative statistics when analysing the performance of the SA-listed property sector over the past 3 years. However, the price action that occurred in the sector during 4Q20 is a key indicator to us of the potential prospects for investors. After falling by a further 8.5% in October, the SA Listed Property Index (JSAPY) returned 33.5% in the last two months of 2020. This coincided with regulatory requirements that real estate investment trusts (REITs) pay out 75% of their distributable earnings on an annual basis, leading to property companies, which reported in the period, declaring and paying out dividends. In addition, the metrics showed that consumers and tenants were returning to malls and offices, albeit at far below pre- COVID normalised levels.
Nevertheless, we highlight that these “green shoots” should not mask the severity of the pain which the sector has borne the brunt of prior to and during the pandemic. The JSAPY has returned:
- -34.5% in 2020.
- -50.1% over the past 3 years (to 31 December 2020).
- -35.6% over the past 5 years (to 31 December 2020).
The above data measure total return i.e., capital appreciation/depreciation plus dividends. When looking at the past 10 years, the total return is 41.4% (a 3.5% compound annual return). This is comprised of approximately 70% dividends and a negative 30% when measuring share price (capital) performance. A more detailed study of annual dividend yields is presented in Figure 1 below.
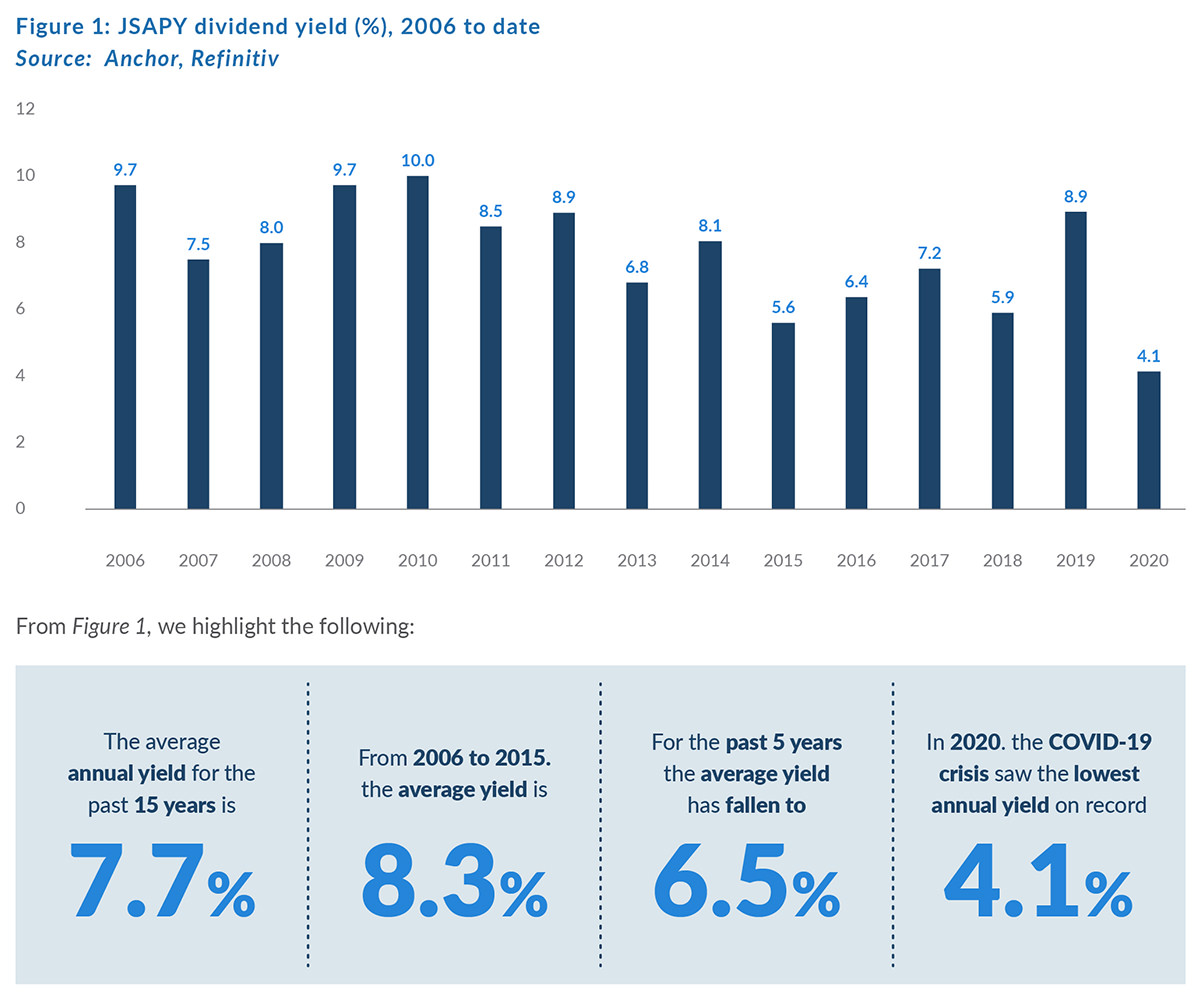
It could therefore be logically argued that share prices anticipate the factors that lead to companies’ income, and therefore dividends, falling. So, although the yield is reasonably consistent, the forecast risk of total return, which includes share price performance, is high. This has been magnified by the pandemic and its impact on the property sector. However, we note that some important fundamental factors remain in place, including:
- The prices of physical property assets have come under pressure, but not to the extent of the discounts to net asset values (NAVs) that are currently being priced in for many listed property companies.
- Dividends will continue to flow into shareholders’ hands, albeit that payout ratios on distributable income may be reduced.
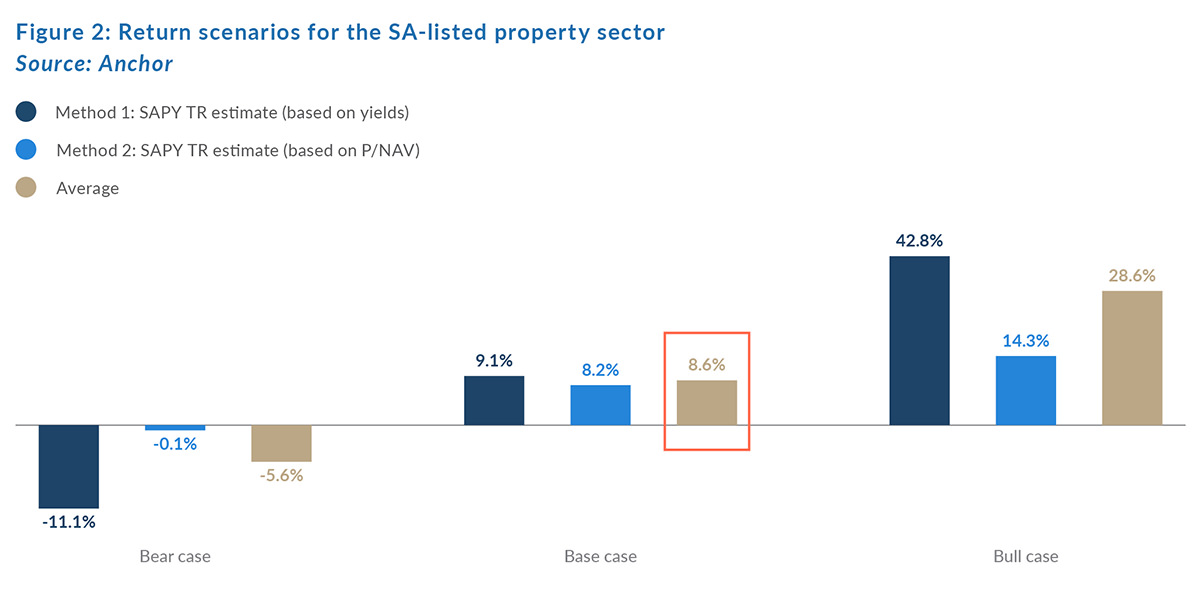
Therefore, when investors can forecast that earnings and dividends have reached the bottom of this cycle, and will grow off the lower base, share prices will re-rate. In our view, that is currently in process, but the recovery will not be V-shaped, and a reintroduction of harder lockdown rules will mean that the best outcome for the next 6-12 months would be a “muddle-through” result, mainly underpinned by our forecast dividend yield of 9.1% and a total return of 8.6%. This is our base-case scenario using a 50% weighted dividend yield and 50% price/NAV methodology. However, as evidenced in the back end of 2020, there can be fairly extreme volatility and a wide range of outcomes are therefore possible.
We therefore remain at a neutral weight on the sector, whilst looking for prospects of a turning point in income generation.
SA BONDS
As last year drew to a close, 4Q20 saw SA bonds strengthen, with the FTSE JSE All Bond Index (ALBI) delivering a full-year total return of 8.65%. Given the significant headwinds which EM bonds faced when the COVID-19 pandemic hit markets in 2020, this again shows the resilience and depth of the local debt market.
4Q20 gave support to SA government bonds, with the 10-year benchmark R2030 opening with a yield of 9.445% and closing at a yield of 8.735%. The curve, in general, remains substantially steeper than it did at the start of 2020 – currently the spread between the R186 and the R2040 bond is 4.31%, while it was 1.77% at the start of last year. Throughout 2020, we discussed this phenomenon – the bifurcation of the SA bond curve. In our view, this story will remain prevalent for as long as National Treasury struggles to reign in the fiscal deficit.
However, we also highlight that this presents investors with a strong yield-to-term relationship as duration is being compensated for with a yield far greater in both absolute (the yields on all bonds beyond the 10-year point are now higher than they were one-year ago) and relative (as indicated by the steepness of the curve) terms.
Looking to 2021, the major events which we believe should drive bond yields are the budget announcements, the rollout of a COVID-19 vaccine, the lowering of lockdown levels (particularly those that have strong adverse effects on economic activity and the fiscus), the SA Reserve Bank’s (SARB) Monetary Policy Committee (MPC) meetings, and the prosecutions of those guilty of corruption.
Our baseline scenario is for the SARB to start the rate- hiking cycle towards 1Q22 – thus keeping rates at historically low current levels for the year. We note though that this expectation is extremely sensitive to data releases – the MPC has proven to be exceptionally cautious and any sign of heightened inflation will likely result in rate hikes to keep inflationary pressures subdued. Given this possibility, we expect the SA bond curve to remain steep, pegged down at the short end by the low repo rate (currently at 3.5%), and pulled up by the various idiosyncratic risks which the country faces, as well as the general EMs risk premium.
2020 has seen a substantial movement in both the shape of the yield curve and in the volatility local bond investors have faced. At the peak of the March sell-off, the R2030 traded at yields of over 12.3%.
Looking to 2021, inflation has been subdued since the start of the pandemic and is expected to remain low over the near term. In this environment the yield on offer for SA duration assets remains attractive.
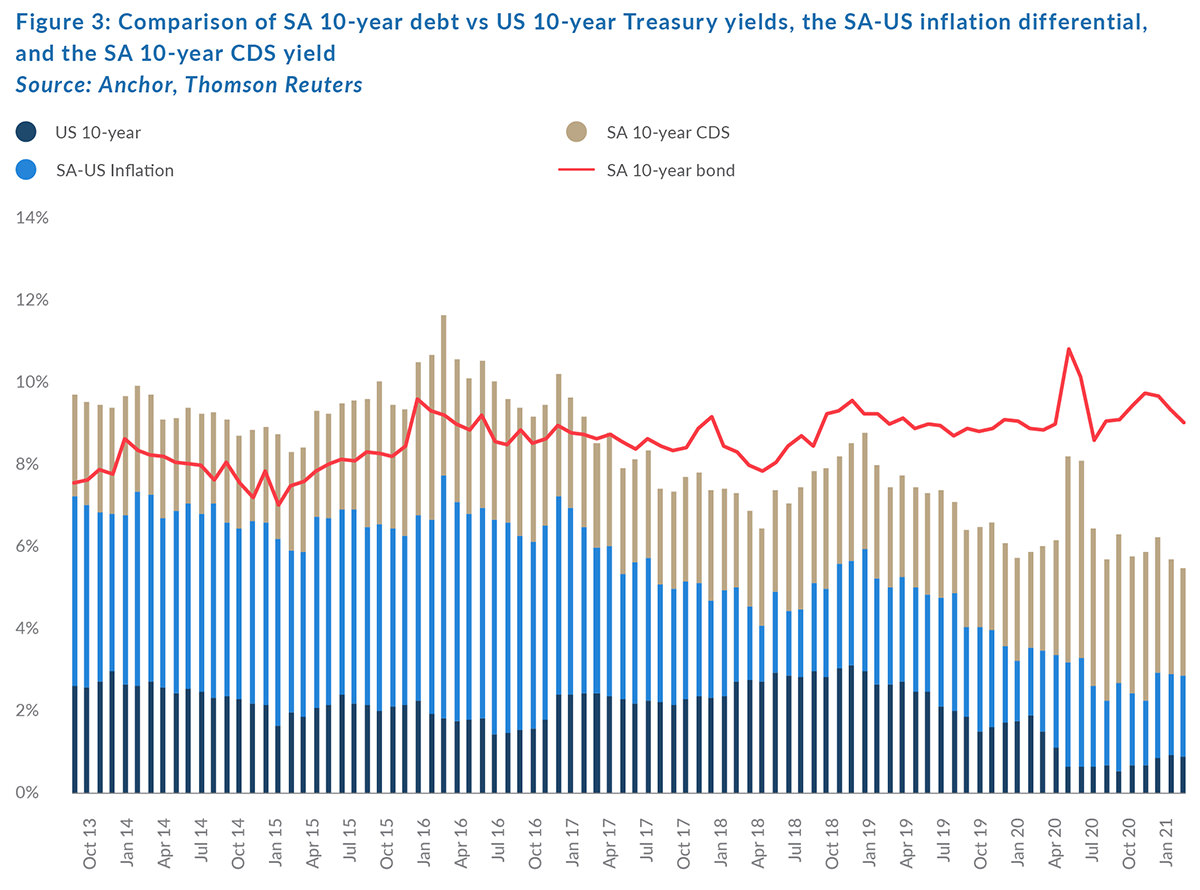
Below we construct a comparison of the relative attractiveness of SA 10-year debt vs a synthetic reconstruction using a sum of the following:
- SA inflation less US inflation (SA CPI-US CPI);
- US 10-year treasury yields; and
- SA 10-year credit default swaps (CDS).
The results are depicted in Figure 3 below, which also shows that the country’s fiscal position has deteriorated, and the spread has gone from being negative (where SA debt yields less than the synthetic sum of yields above) to being strongly positive. It is currently 3.6% more attractive to hold SA debt than it is to be a holder of the synthetic construct described above.
We also note the attractiveness of SA government bonds on a relative basis, where SA real yields remain attractive (currently the real yield on the 10-year bond is 5.4%).
We accordingly think that the fair yield on the benchmark R186 bond is about 6.7%, while that of the R2030 bond is about 8.8%. In our view there is some scope for the longer-dated 20-year bonds to rally a little over the period. This gives us an expected return for the ALBI of 8.80% which all comprises interest income.
RAND
Over the year as a whole, the rand was relatively stable in 2020, weakening by 4.7%. However, within that period, we saw extreme moves with the currency setting a new weakest level record of R19.35/US$1 in March, before recovering to end the year at around R14.65/US$1.
Projecting the rand’s value in a year’s time is a fool’s errand. The rand vs US dollar exchange rate is one of the world’s most volatile currency pairs and trades well away from any modelled fair value for long periods. We note, however, that the rand trades within a R2.50 range to the US dollar in most 12-month periods.
Currently, the US dollar seems to be in a weakening cycle. However, we cannot be certain how long this will persist although we maintain our view that the cycle probably has no more than another 5% of dollar weakness remaining. Such weakness, coupled with bringing the COVID pandemic in SA back under control, should give support to the rand. We also remain watchful of SA’s trade balance, which remains positive and will also help support the local currency more than we have seen in the past. For now, the risk remains for a slightly stronger rand in the medium term.
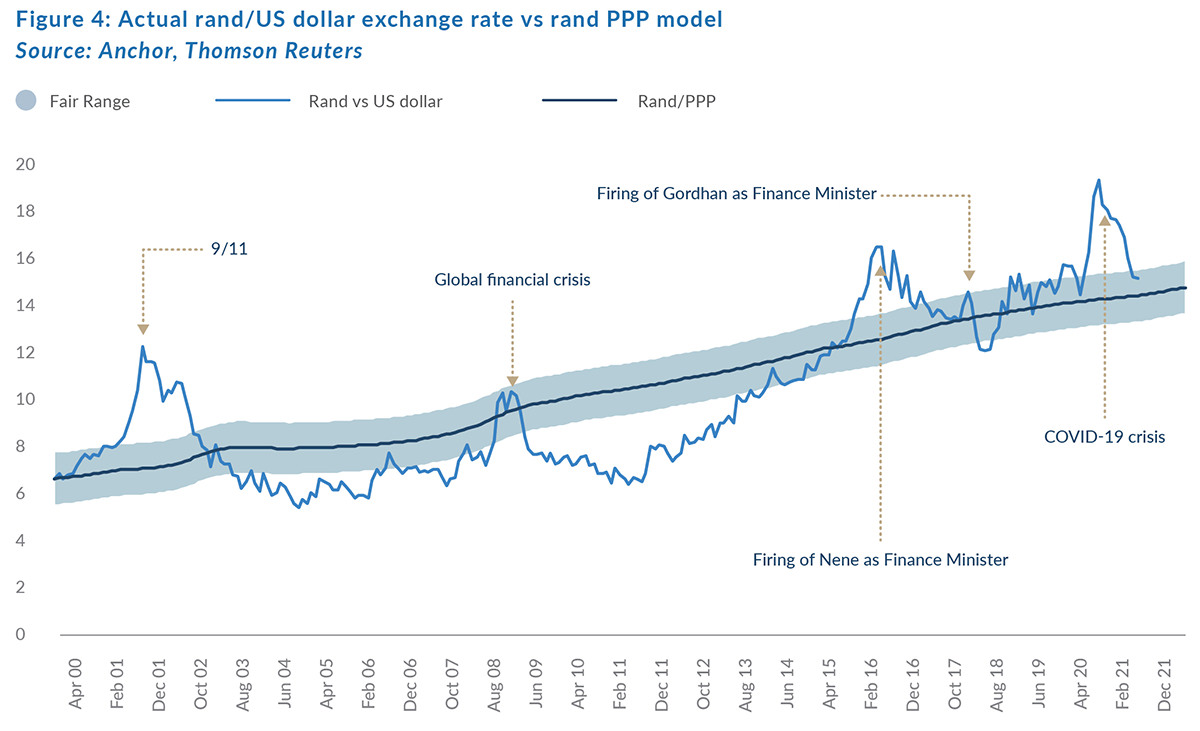
We retain our purchasing power parity (PPP) based model for estimating the fair value of the rand and we have extended this out by three months since the publication of The Navigator – Anchor’s Strategy and Asset Allocation, 4Q20 report on 12 October 2020. Our PPP-modelled value for the rand vs the US dollar at the end of the next 12 months is R14.30/US$1 (See Figure 4). We apply a R2.00 range around this to get to a fair value range of between R13.30/US$1 and R15.30/US$1.
We expect the rand to remain particularly volatile although we do think that it might touch the mid-point of our fair band. This would imply that we see scope for up to a 2.4% improvement from the rand’s current levels as global macro factors dominate.
GLOBAL EQUITY
Global equity markets ended the year up around 16% (MSCI World +16%, S&P +18%, FTSE down 14%, EMs +18%), an outcome few would have forecast given the economic slump caused by COVID-19. World GDP growth is likely to end 2020 down around 4.4%, with consensus expecting a rebound of 5.2% in 2021.
While we are able to identify numerous shares, we are happy to own for the next 12 months and beyond, we are more cautious on index levels on a 12-month view. Almost all respected forecasters of market returns were badly wrong in 2020 (twice!) and hence the (very pervasive) consensus for a positive 2021 should be viewed with some healthy scepticism.
Our 5% 12-month US dollar forecast return for the MSCI World Equity index is relatively low conviction, given the range of potential outcomes.
The primary justification for being bullish on equities in 2021 is the fact that central banks are providing unprecedented stimulus to the global economy, which has manifested itself in the double-barrel impact of low rates (you cannot make money unless you take risk) and massive liquidity. Historically it has generally been unwise to “fight the Fed” and this is probably reason enough to maintain a healthy equity weighting. Reasons two and three for a bullish stance are pretty universally the obvious … the pandemic being defeated and big YoY earnings growth in 2021 (off a 2020 earnings base in the US, which is likely to end 18% down).
But as fundamental, bottom-up, growth investors we cannot help feeling a little uneasy. We do believe valuations count and on that score the market is very expensive at a forward PE of 21.3x (MSCI World) and 22.6x for the S&P. This incorporates a substantial part of the anticipated global recovery. The average S&P forward PE for the last 10 years is 17, suggesting the market valuation levels are 33% higher than the average of the last decade.
We have been in a rampant bull market since the bottom in March 2020 – in fact, we are up over 65% since the virus-infected bottom. Investors are getting worryingly comfortable and it is not unusual for the market to remain bullish on big companies (with 10%-odd sustainable earnings growth numbers) trading at 30x-40x PE multiples (e.g., Microsoft). New IPOs have experienced extreme bull market characteristics. We valued Airbnb at around US$60/share on listing and it quickly traded at over US$140/share.
So, let us just take a step back and think about the earnings fundamentals – S&P earnings growth numbers for 2020, 2021 and 2022 are projected at -18%, 30% and 17%. The big growth in 2021 should not be interpreted as sustainable or that meaningful, as a big element is clearly recovery from a low base. The key determinant of where market levels trade at the end of this year, will be the expectation for 2022 and sustainable earnings growth thereafter. This will probably revert to historic averages – in the region of 6%-7%.
While our base case is that the market goes up from here, what is glaringly obvious is that perfection is priced into many companies and probably the market as a whole. Rising global yields, an inflation surprise, some virus, or vaccine hiccups (should we not expect these?), or some Chinese economic aggression (or many other things which we cannot anticipate as we have learnt this year!) have a greater-than-usual potential to cause a material drop in markets, given the elevated starting point. We are generally happy to accept these gyrations, but the logical conclusion right now is to be on high alert and construct portfolios with this in mind.
And if stimulus is the key driver, do we need stimulus to get incrementally bigger to sustain the market moves? Morgan Stanley uses the phrase “peak stimulus” in its analysis and estimates that this happens in the next few months – the point at which economic recovery and the sheer scale of current stimulus means that the tank attendants slowly start injecting less rocket fuel as the tank becomes full. How much money can the world print?
An important and very material last point is that we are at a unique point in history, where technology is changing the world and we are ardent believers in the secular trends being sustained. The way we do business is changing dramatically and the business models that have emerged, which enable companies to scale at an unprecedented rate if they have a good idea (the network effect) with good execution, is creating cash flow monsters with extremely high returns and very high margins. Anchor clients have benefitted materially from exposure to high- growth tech companies and the compelling and enduring nature of their growth rates means that macro concerns are much less relevant, but it does not mean that they cannot experience material dips on their upward journey. They inevitably will.
We are also very conscious of the fact that, as valuations increase in this sector (which is now over 35% of global market cap), we have to become increasingly sensitive to share selection – many of the tech favourites will not achieve their now ubiquitous five and 10-year forecasts made to justify their valuations (I have never got the three-year forecast for a company right!). You have to own the winning businesses – at these valuations the losers will cost you big. This is no time for indices which provide a broad thematic smattering.
On the subject of ETFs, and passive investing, we believe that they have a place and we sometimes use them in our portfolios for certain themes or geographical exposure. At the end of a bull market, they can become more dangerous as the most expensive shares achieve the highest weightings and there is no ability to exclude bad businesses. We are proud, as active investment managers, to have consistently beaten our chosen equity benchmarks after costs. Passive investing guarantees underperformance relative to the same benchmarks.
We are in a bull market and it is probably equally dangerous to 1) call the top, or 2) dismiss the obvious risks. We feel uncomfortable making a 12-month projection, as is industry convention, and we have learnt this year so much can happen in this timeframe (2020 was down 35% and then up 65%!). Our forecast tables will reflect a mundane and seemingly unconvicted 5% 12-month return forecast, but what is more important is our investment approach over the next 12 months:
- Our portfolios will follow our investment philosophy of investing in high-return companies whose valuations are justified by their long-term growth rates.
- We will ensure investors have sufficient exposure to companies that are changing the world.
- We will also seek to invest in good quality companies whose share prices have not been caught up in the hype.
- We start the year with relatively high equity weightings, cognisant that bull markets can last longer than seems justified. But caution is warranted.
- We will be alert and ever conscious of risks (to growth or valuation). We will be nimble and sufficiently conservative.
- We will be conscious of the facts, especially valuation.
- We will remember that global equities are the best place to invest over the longer term.
GLOBAL PROPERTY
Developed market REITs bounced hard in 4Q20 in response to the prospect of the imminent rollout of COVID-19 vaccines. The sectors hardest by the pandemic were unsurprisingly the ones that bounced hardest (retail REITs rallied 26% in 4Q20 and office REITs jumped by 15%). Despite a mid-teen bounce for global REITs in aggregate for 4Q20, it was still a tough year for the asset class, which ended 2020 down 10% – comfortably trailing most risk assets. The 10% de-rating though, has largely come in the form of lower dividend expectations, with retail-, office- and residential REITs all seeing their expected dividends for 2021 at around 20%–35% lower than investors had expected from them going into 2020 (i.e. before the pandemic upset the apple cart). This contrasts with the pandemic-beneficiaries such as data centers and warehouses which have seen their income expectations jump by the high-teens during 2020. However, given the smaller universe of pandemic beneficiaries, the aggregate numbers still look dismal.
We do expect vaccination rollouts to entice people back into crowded offices and malls as well as high-rise buildings in densely populated cities, but we think this process may take some time and we fully expect things to get worse before they get better. Many tenants are still figuring out their space and location requirements in a post-pandemic world and are unlikely to overcommit before it is clear that trends have indeed shifted. Thus, we think there is still plenty of scope for tough negotiations with landlords and for vacancy rates to get slightly worse before they get better.
We expect that as 1Q21 and 2Q21 results start to reflect the reality of the still-worsening environment for the retail, residential and office sectors, there is scope for a 3% to 5% de-rating in income expectations, although we believe that at least half of this will start to reverse in 2H21 as the trend starts to improve. As a result, we expect investors to end the year with a total return of around 2.5% for the asset class.
GLOBAL BONDS
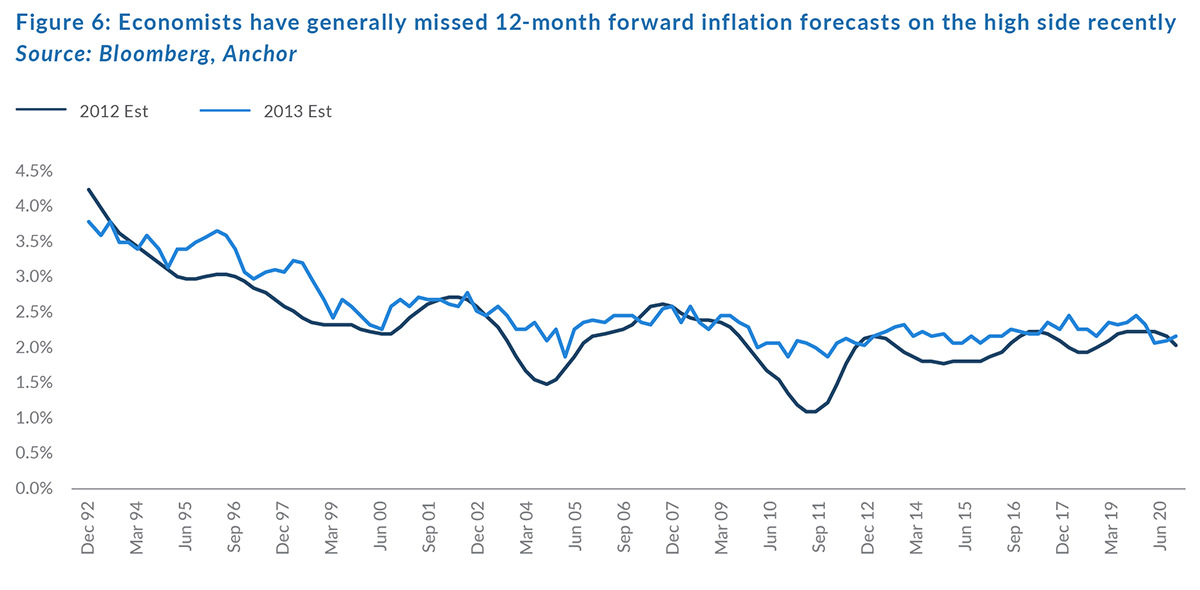
It has been said that economic forecasts are only really helpful in making weather forecasts look accurate. While this is perhaps a bit harsh, it is fair to say that even the best econometric models are unable to factor in the “unknow unknowns” – economic shocks like pandemics. Looking back at the recent past, economists have tended to miss on the high side when looking 12-months out at US 10-year government bond yield expectations.
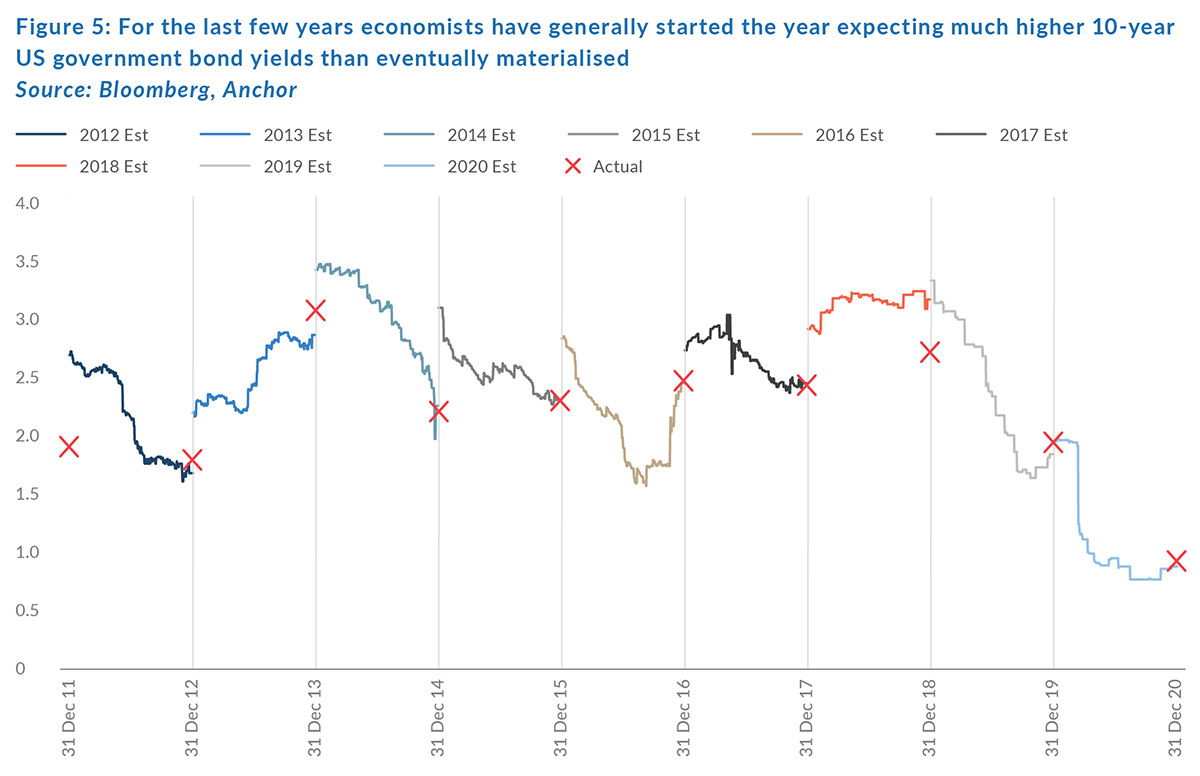
The exceptions were in 2013 when the “taper tantrum” caught investors off guard with the prospect of indefinite quantitative easing (QE) baked into expectations that the US Federal Reserve (Fed) had caught markets by surprise with the announcement of its plan to gently remove the monetary punch bowl. The other upward rate shock came towards the end of 2016 when a surprise Donald Trump presidential victory ushered in the prospect of fiscal stimulus (via tax cuts) and stronger economic activity. Economists have also generally been more likely to overestimate US inflation, usually missing the shocks to the downside.
Economists are now expecting US 10-year bond yields to end 2021 at around 1.25% and we think this is probably based on expectations for continued QE, benign inflation, and a steady recovery in economic activity as the vaccine rollout ushers in a reduction in movement restrictions globally.
In our view, shocks to these expectations are likely evenly balanced, with a supply-side shock in the form of larger-than-expected US fiscal stimulus resulting from the Democrats gaining more influence in the Senate and a demand side shock in the form of QE tapering sooner than expected the most likely “surprises”. We believe that the Fed will tread extremely cautiously with the latter scenario especially given the fragile state of the global economy and so place a slightly lower expectation on the “higher-than-expected” US rates outcome and end up with a US 10-year yield forecast of 1.15%, leaving investors in US 10-year government bonds with a base- case total return of 0.4%.
Corporate bonds are likely to experience only a marginally better outcome with central banks expected to remain a buyer of last resort for high-grade US corporate bonds. That said, we see it as unlikely that US investment-grade credit spreads can get lower than their current 1% level, particularly as economic stress and the lapsing of fiscal and central bank credit support programmes results in slightly higher defaults. With credit spreads remaining largely unchanged over the next 12 months that should combine with slightly higher interest rates to leave investors in US high-grade corporate bonds with an average total return of around 1.2%