Executive summary
Most investors with an allocation to offshore stocks and bonds will find themselves heavily skewed towards US dollar-denominated assets. Investors frequently ask us if they should diversify some of their global cash holdings away from US dollars. For the purposes of this exercise we will focus on the four most liquid non-US dollar currencies the euro (EUR), Japanese yen (JPY), British pound (GBP) and the Swiss France (CHF).
- Currently, five countries (China, Japan, Switzerland, Saudi Arabia and Russia) account for more than half of all global foreign exchange reserves and for c. 60% of the accumulation of foreign exchange reserves this century.
- The US dollar makes up more than 60% of foreign exchange reserves (the euro is a distant second with c. 20%), but the accumulation of US dollar reserves by global central banks has NOT been a meaningful factor in explaining the US currency’s movements.
- Unprecedented levels of fiscal and monetary policy support introduced by the US in response to the COVID-19 crisis have led to concerns about the build-up of US debt. BUT nothing the US is doing from a stimulus perspective is particularly alarming relative to the size of its economy when compared with what its major currency peers are doing.
- There are structural challenges haunting each of the four major non-US dollar currencies but, rather than dismissing them on that basis, we examine whether their valuations already compensate for those risks. We use real effective exchange rates (REER) and purchasing power parity (PPP) as the main tools for our long-term valuation assessment.
The developed market (DM) investment universe is heavily skewed towards US dollar-denominated choices
More than 40% of stocks (by market cap) have their primary listing in the US.
Figure 1: Global stocks’ primary country listings by market cap
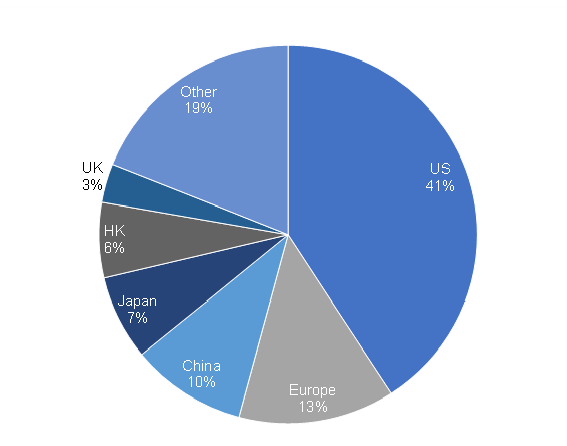
Source: Bloomberg, Anchor
A similar proportion of global bonds are also issued from the US.
Figure 2: Global bonds’ country of issue by notional value
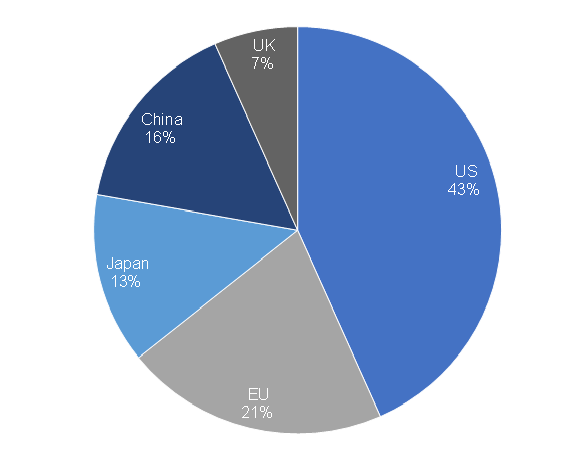
Source: IMF, Anchor
US dollar asset concentrations, as shown in Figure 1 and Figure 2 above, are even higher when investors are looking for the most liquid bonds or many of the fastest-growing, mega-cap companies. As a result, most investors with an allocation to offshore stocks and bonds will find themselves heavily skewed towards US dollar-denominated assets. While many US-listed stocks have globally diversified earnings, reducing their exposure to the US economy and currency, investors frequently ask us if they should diversify some of their global cash holdings away from the US dollar. In this note, we discuss the prospects for the US dollar and some of the alternative currencies in which investors might choose to hold their cash.
When it comes to DM currencies, investors typically consider those in Figure 3 to be the “majors”.
Figure 3: DM currency “majors”
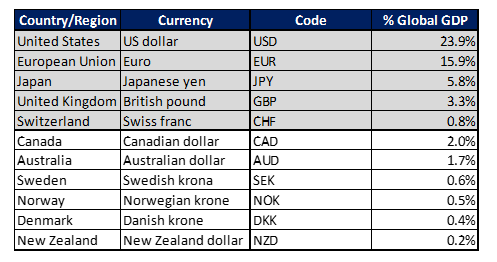
Source: Bloomberg, Anchor
For the purposes of this exercise we will focus on the four most liquid non-US dollar currencies – the euro, Japanese yen, British pound and the Swiss franc.
The Swiss franc and the Japanese yen are generally considered haven currencies that investors flock to in times of uncertainty. The euro and British pound are currencies of the two biggest non-US DM economies (excl. Japan).
Quoting convention is different for these four currencies, with the euro and the pound quoted as the amount of dollars that can be purchased for each euro or pound, while the yen and Swiss franc are the opposite, generally quoted as the number of yen or Swiss franc purchased with each US dollar. So, for the euro and the British pound as the number gets higher it indicates a strengthening currency, while the opposite is true for Swiss franc and the yen.
The world’s reserve currency
In 1944, after the Second World War, the Bretton Woods system established the US dollar as the world’s reserve currency and, even after the demise of that system in 1971, the US dollar has maintained that status with roughly two-thirds of all global foreign currency reserves held in US dollar.
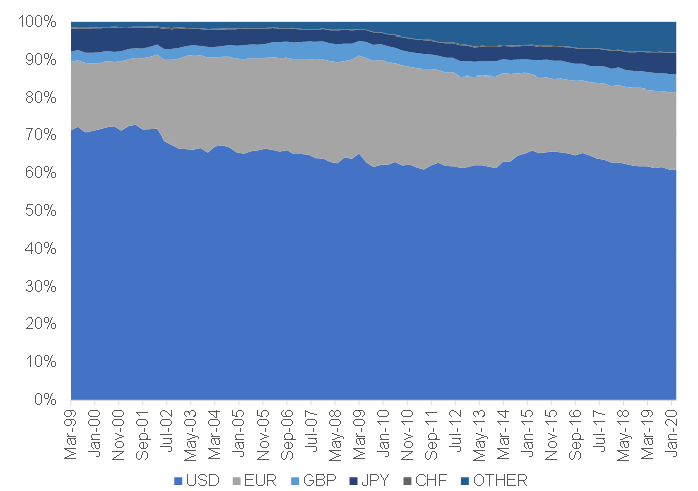
Figure 4: The US dollar share of global currency reserves
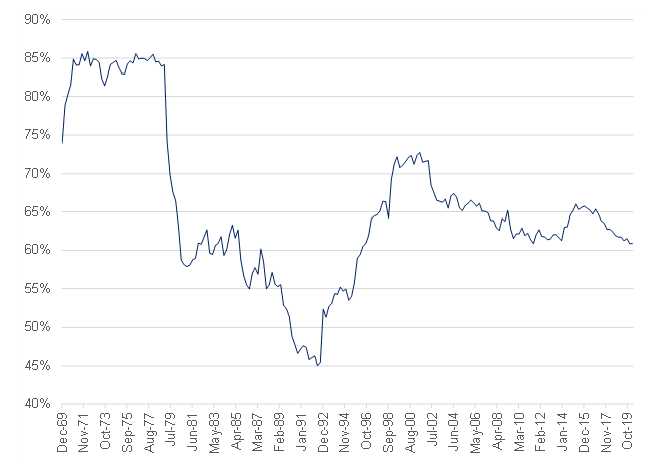
Source: Bloomberg, Anchor
The euro is the second-most popular reserve currency held by central banks, although at c. 20% of global foreign exchange (FX) reserves it is still a distant second to the US dollar. The Japanese yen and the British pound each account for around 5% of global FX reserves and then there is a long tail of low, single-digit numbers making up the difference. The Chinese renminbi, at around 2% of global FX reserves, is massively underrepresented relative to the size of its economy and it will likely grow to play a more meaningful role in the future. However, before that happens China needs to achieve significantly more transparency and less restricted access to its economy.
Figure 5: Breakdown of global currency reserves
Source: Bloomberg, Anchor
Central banks accumulated FX reserves aggressively during the first decade of the twenty-first century.
Figure 6: Global FX reserves as a % of global GDP
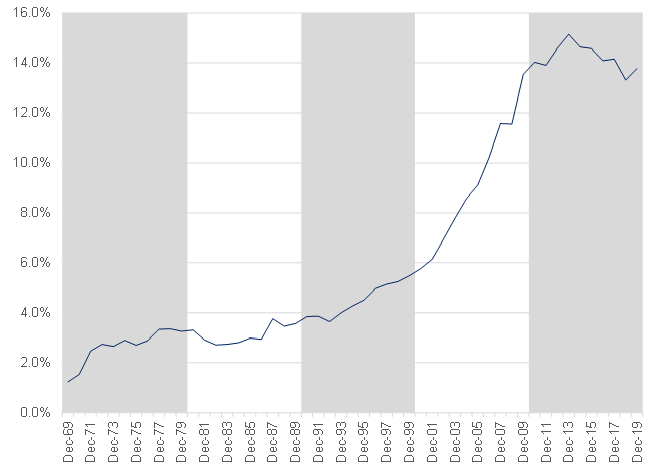
Source: Bloomberg, Anchor
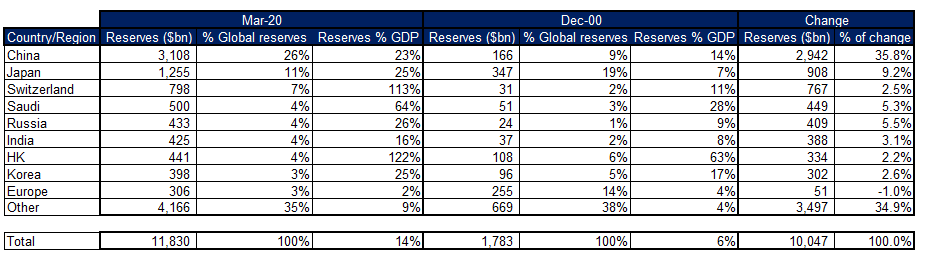
Five countries account for more than half of total global foreign reserves (and c. 60% of the accumulation of foreign reserves during this century).
- China is by far the biggest holder of foreign currency reserves, much of which was aggressively accumulated maintaining a peg to the US dollar and fighting the strengthening of its currency that might have otherwise occurred through demand from foreign importers of Chinese goods.
- Japan has also consistently intervened in currency markets, accumulating the world’s second-biggest haul of foreign currency reserves, while the resultant currency weakness has helped maintain the competitiveness of its exports and a consistent current account surplus.
- Switzerland accumulated the third-biggest pile of foreign currency reserves in attempting to maintain a peg to the euro between 2011 and 2015, when it eventually abandoned the idea.
- Russia and Saudi Arabia complete the top-5 countries holding global FX reserves, with the world’s biggest oil exporters having accumulated the bulk of those reserves during 2007 and 2008, when the oil price spiked to above $100/bbl and the world briefly became concerned about running out of oil (this was before the discovery of massive US shale reserves).
Figure 7: Global FX reserves holdings by country/ region
Source: Bloomberg, Anchor
The accumulation of US dollar reserves by global central banks has NOT been a meaningful factor in explaining that currency’s movements. During the 1980s, the US dollar appreciated by 94% against its trading peers, while global US dollar reserves shrank by 1.5% relative to US GDP. During the first decade of this century, global US dollar reserves jumped by 10% of US GDP, while the US dollar fell 12.5% against its trading partners.
Figure 8: Global US dollar reserves as % of US GDP by decade vs the US Broad Trade Weighted Dollar Index
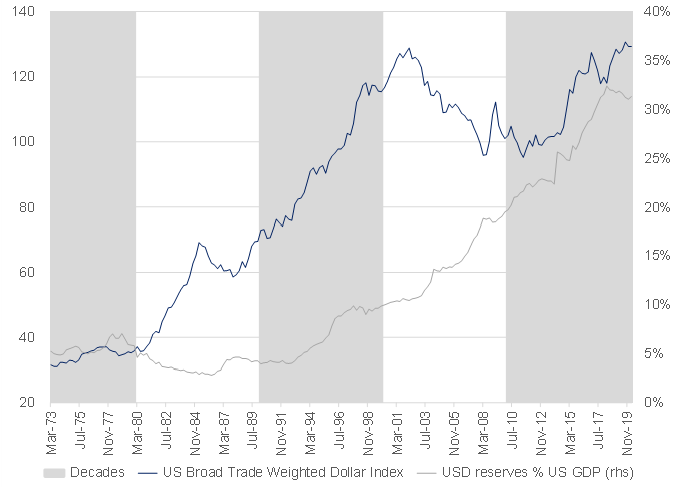
Source: Bloomberg, Anchor
What is causing US dollar anxiety?
Unprecedented levels of fiscal and monetary policy support introduced by the US in response to the COVID-19 crisis have led to concerns about the build-up of US debt. So, how does that compare to the other majors?
The US fiscal position was already deteriorating going into the COVID-19 crisis as the Trump administration’s tax cuts pushed the US government into a 5% budget deficit, comfortably the worst among the economies we are focussing on. The aggressive US fiscal stimulus response to the crisis will likely also result in the country’s budget deficit expanding by more than that of the relevant peer group.
Figure 9: Budget balance as % of GDP by country
Source: Bloomberg, Anchor
The US’ higher budget deficit for the next couple of years is likely to see the US government’s debt to GDP ratio expand faster than its peers (by 5%–10%), though even then its relative government debt burden will still likely lag those of the European Union (EU) and the UK and be only half that of Japan, which is in a league of its own when it comes to government indebtedness.
Figure 10: Government debt as % of GDP
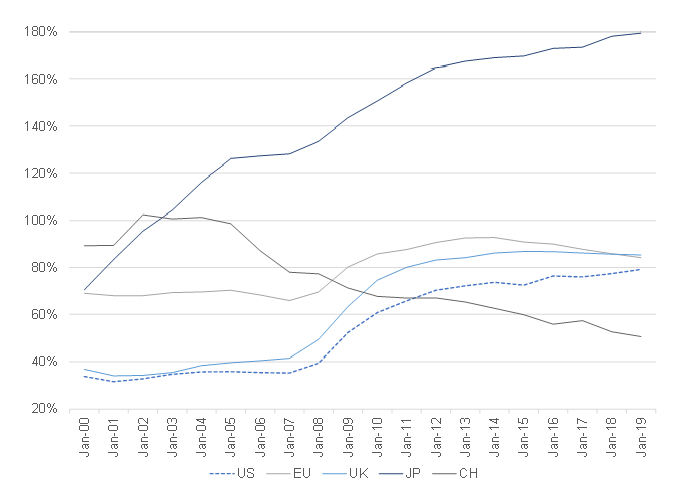
Source: Bloomberg, Anchor
Much of the additional government debt has been absorbed by major central banks, which have expanded their balance sheets significantly since the global financial crisis (GFC) and even more aggressively since the COVID-19 crisis.
Figure 11: Global quantitative easing, $trn
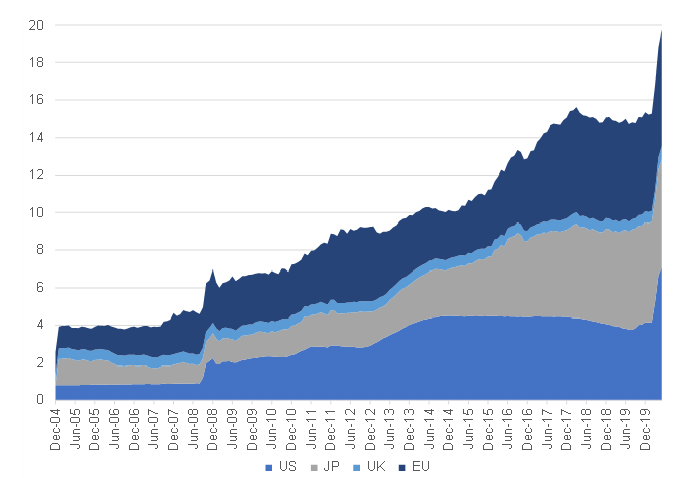
Source: Bloomberg, Anchor
The numbers out of the US have been eye-watering and have certainly caught the attention of the popular press, but it is also the largest economy in the world and, relative to the size of its economy, the US central bank’s balance sheet is still smaller than those of the EU and Japan.
Figure 12: Central banks’ balance sheets as % of GDP
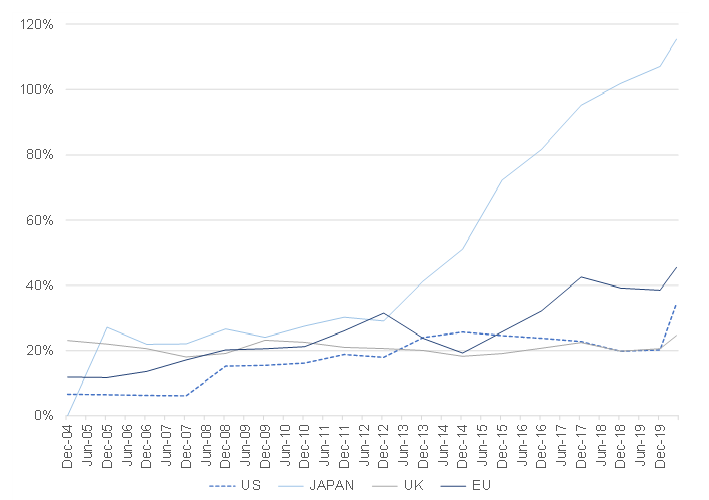
Source: Bloomberg, Anchor
So, on a relative basis, nothing that the US is doing from a stimulus perspective is particularly alarming relative to the size of its economy when compared with what its major currency peers are doing.
Is the US dollar just the best of a bad bunch?
It is easy to look at those four majors vs the US dollar and craft a TINA (There Is No Alternative) argument based on the challenges in each of those economies:
Euro: Europe has struggled to straddle the divide between a unified monetary system and a segregated fiscal system. This has caused continuous ructions including a banking crisis which started during the GFC and reared its head again in 2010 and 2012 as the Southern European “PIGS” (Portugal, Italy, Greece and Spain) struggled to refinance their government debt and bail out their over-indebted banks. It also reared its head in the form of political discontent in the 2016/2017 elections of some of the major European economies, with Eurosceptic parties gaining meaningful traction in France (Marine Le Pen’s National Front), Italy (Northern League and the Five Star Movement), the Netherlands (Geert Wilders’ Party for Freedom) and Spain (Podemos). The UK’s ongoing separation with the EU also creates a precedent for the potential dismantling of the single-currency bloc, which remains the biggest risk for investors holding euros.
British pound: After nearly four years of huffing and puffing the UK finally formally left the EU on 1 February 2020. The status quo governs the trading relationship with the EU for the next year as the parties try to negotiate favourable access to their largest trading partner going forward. The UK economy is now a similar size to India (which is growing significantly faster) and has a large external funding requirement at a time when its status as an important source of capital is comfortably eclipsed by the US and a few major Asian capital markets. We believe that it needs to reinvent its role in global capital markets going forward and its currency is hostage to that uncertainty.
Japanese yen: The third-biggest economy in the world (fourth if you consider Europe as a single economy) has not been able to achieve any meaningful inflation this century and economic growth has averaged just 0.2% p.a. over that time. Ageing demographics and draconian immigration restrictions present an ongoing headwind to achieving meaningful inflation or demand driven growth. This is despite a Herculean QE effort, which has seen the country’s central bank buy government bonds for over 25 years. At a time when other major central banks are experimenting with the purchase of corporate bonds, the Bank of Japan has long surpassed that, purchasing Japanese equities for the past ten years.
Swiss franc: Switzerland’s status as a neutral, apolitical, prudently managed global banking hub (which has been running a meaningful current account surplus since 1983) has put it in high demand as a haven currency. Pre-GFC, investment income derived from the banking and insurance sectors accounted for c. 50% of the surplus, which dried up following the introduction of negative rates in Switzerland. Today, the surplus is almost entirely driven by trade with large pharma and merchanting sectors, as well as equity investments held by foreign-controlled entities, distorting flows to such a degree that they offer few clues to the direction of the Swiss franc.
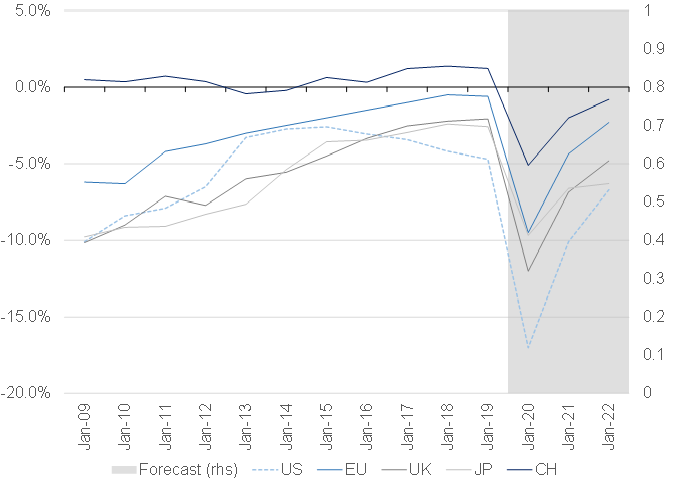
Added to that, the US economy has really been the only major DM game in town this century. The US has comfortably outgrown the EU and Japan for each of the first two decades of this century.
Figure 13: GDP differentials, US vs Europe and Japan
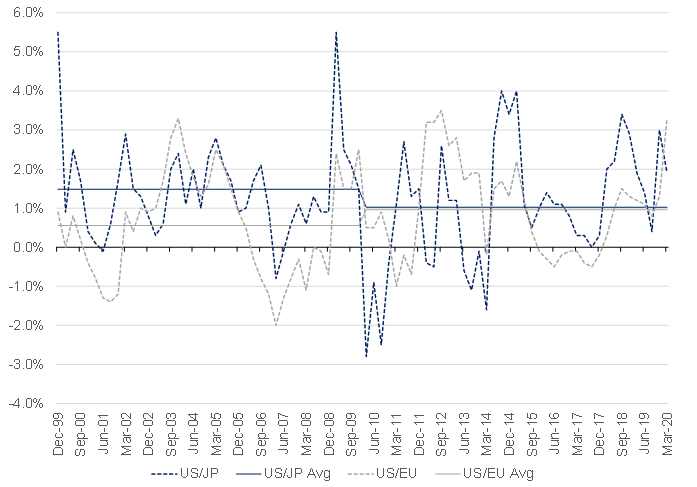
Source: Bloomberg, Anchor
The UK and Switzerland managed to almost keep pace with US growth in the first decade of the twenty-first century, but they too have lagged the US (by c. 1%, on average) for the most recent decade.
Figure 14: GDP differentials, US vs the UK and Switzerland
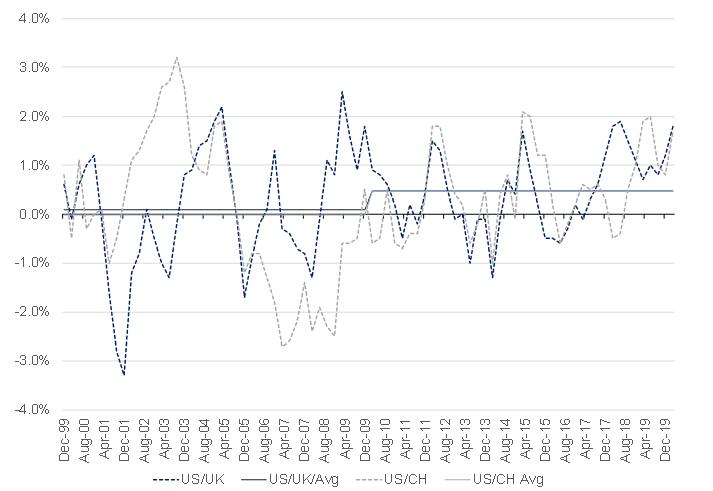
Source: Bloomberg, Anchor
So, it would be easy to dismiss the alternatives as flawed or inferior, but it is worth reviewing the fundamentals before we completely dismiss them, after all what if current exchange rates are already discounting those concerns.
What about currency fundamentals?
There are two main ways to evaluate the fundamentals of currencies, the first focuses on inflation differentials and (somewhat related) yield differentials or carry and explores how those impact relative purchasing power. The second looks at currencies relative to their major trading partners and calculates how that affects their global trade and current account.
- Purchasing power parity
Finance theory suggests that a country with lower relative inflation should see its currency appreciate to maintain PPP. This equilibrium is supported in practice by the ability of citizens of the country with higher inflation to import goods from those countries with relatively lower inflation (because the prices will not have risen as much in that country). The process of importing those goods will create demand for the currency of the country with lower inflation, causing it to appreciate and restore exchange rate equilibrium. Central banks generally set interest rates based on prevailing or anticipated inflation rates and the relative yields (carry) further tend to reinforce purchasing power. Calculating how currencies have fared relative to how PPP suggests they should have, is very sensitive to the starting point of that calculation. To mitigate against this, we generally average the calculation over various starting points. In the charts that follow, we look at how PPP suggests the four major DM peers should have fared based on PPP going back twenty years and averaging over starting dates three years apart.
- Real Effective Exchange Rates
REER is a method of creating an index for each currency based on its exchange rates with a basket of its largest trading power, weighted according to the relative quantum of trade with each of those partners and then adjusted for inflation. The Bank for International Settlements (owned by global central banks and headquartered in Basel, Switzerland) calculates and publishes a REER Index for each global currency monthly. In terms of those currencies that we are looking at, Switzerland, Japan and Europe are all net exporters generating fairly consistent current account surpluses (and, typically, preferring their currencies to weaken to maintain the competitiveness of their exports), while the US and the UK are net importers running pretty consistent current account deficits.
Figure 15: Current account as % of GDP
Source: Bloomberg, Anchor
We will explore those two valuation methodologies for the US and each of the four major alternative DM currencies below:
US dollar
1. PPP
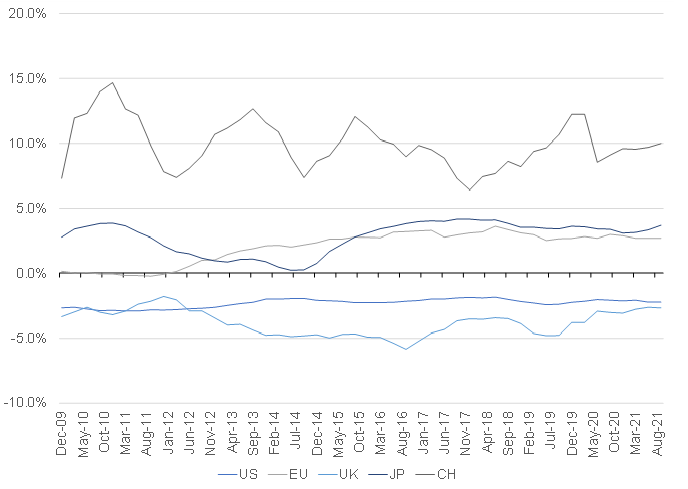
The US has maintained a comfortable inflation advantage relative to the major DM peers over the first couple of decades of the twenty-first century (with the exception of the UK, which has had marginally higher inflation than the US for the past 10 years).
Figure 16: Inflation differential – US vs its peers
Source: Bloomberg, Anchor
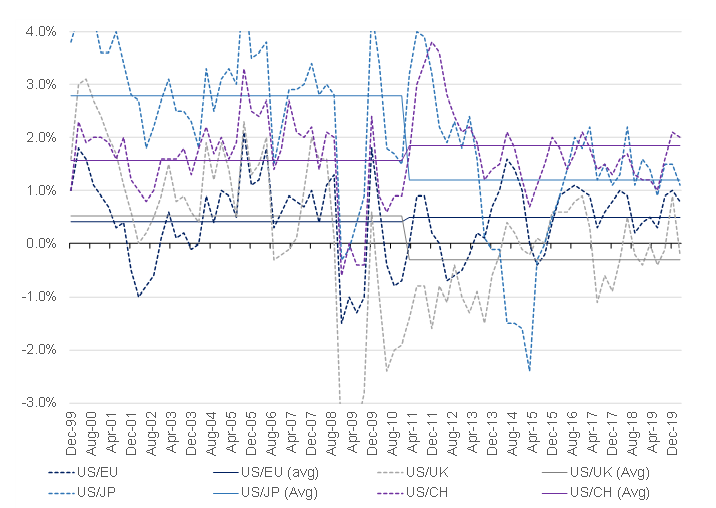
As expected, the relative carry has largely mirrored that relationship as US short-term interest rates have exceeded those of its DM peers. That relative advantage has recently diminished thanks to aggressive monetary policy, but it is still marginally positive in a world where basis points have become ever more meaningful.
Figure 17: Three-month carry vs the US dollar
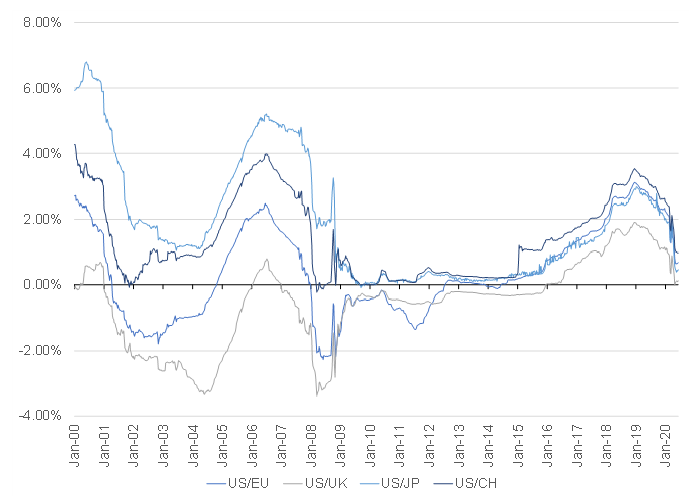
Source: Bloomberg, Anchor
Part of the US’ advantage in this regard comes from its superior demographic trends, particularly relative to Europe and Japan. A recent PEW survey suggests that c. 14% of the US population were born outside the country, so the US relies fairly heavily on immigration for population growth and the Trump administration’s increasingly hostile stance towards immigration will be a contributing factor as the trend from the past 25 years shows it gradually losing that advantage. UK net population growth is almost entirely from immigrations (with 30%–40% of immigration coming from the EU) and the recent change of heart on immigration might see the UK also losing that growth tailwind going forward.
Figure 18: Annualised population growth rate (five-year average)
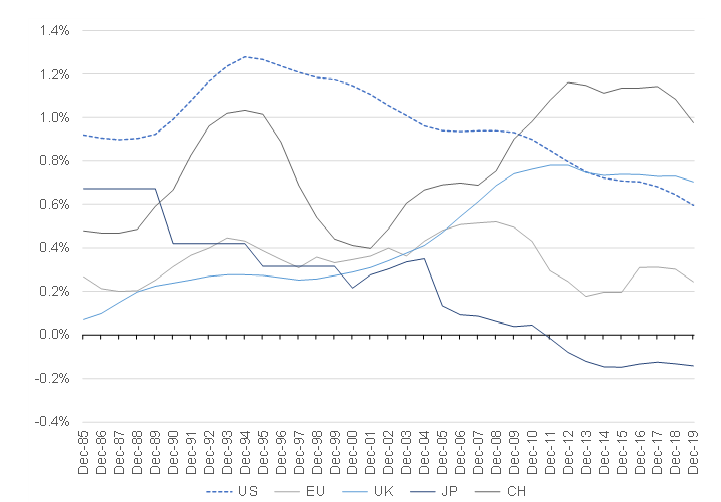
Source: Bloomberg, Anchor
2. REER
Compared to its most important trading partners, the US dollar is about 12% overvalued relative to its 20-year average.
Figure 19: US REER
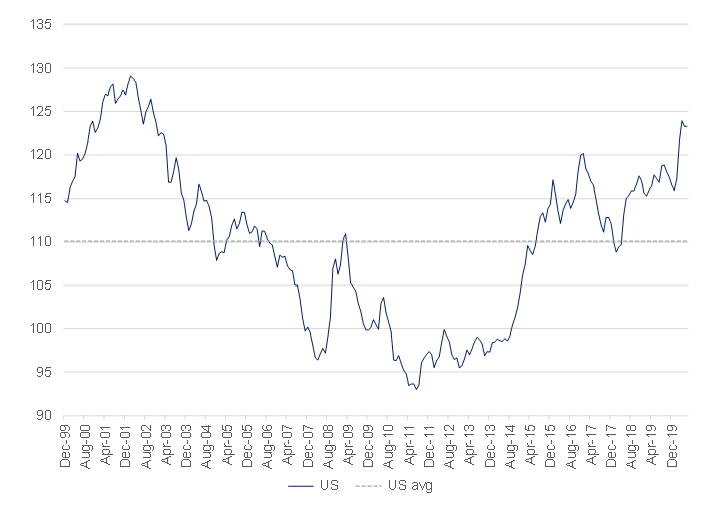
Source: Bloomberg, Anchor
We note that it is not unusual for the US dollar REER to spike when there is uncertainty and probably around half of the US dollar’s current overvaluation can be explained by investors flocking to the relative safety of US dollar assets as uncertainty and volatility spiked.
Figure 20: US REER tends to spike when uncertainty increases
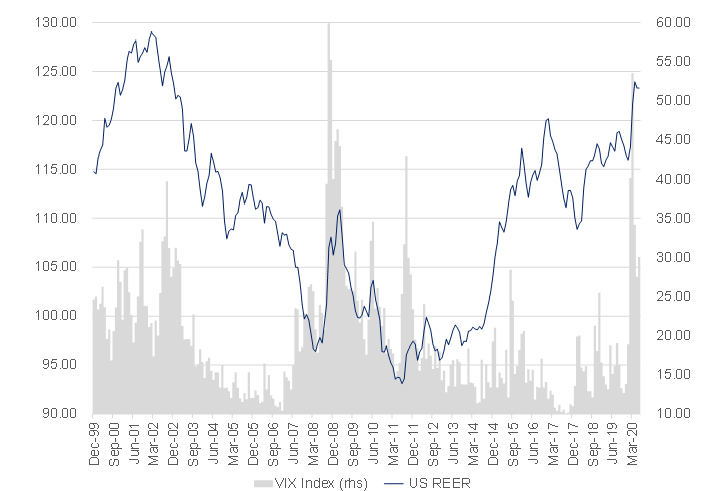
Source: Bloomberg, Anchor
Euro
1.PPP
The euro is moderately cheap when viewed relative to the equilibrium we expect, based on its inflation differential with the US over the past 20-years.
Figure 21: Euro vs its expected PPP trajectory
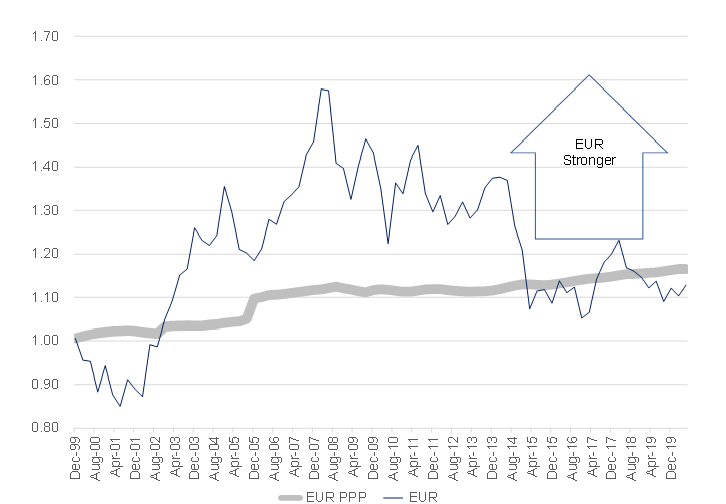
Source: Bloomberg, Anchor
2. REER
The euro is also marginally cheap (4%) relative to its average REER over the past 20 years. The European Central Bank (ECB) has not really intervened directly in the currency markets to support the euro area’s export competitiveness by building up meaningful foreign reserves. The ECB’s attempts to stimulate inflation have come mainly in the form of aggressive monetary policy and abundant QE.
Figure 22: Euro REER
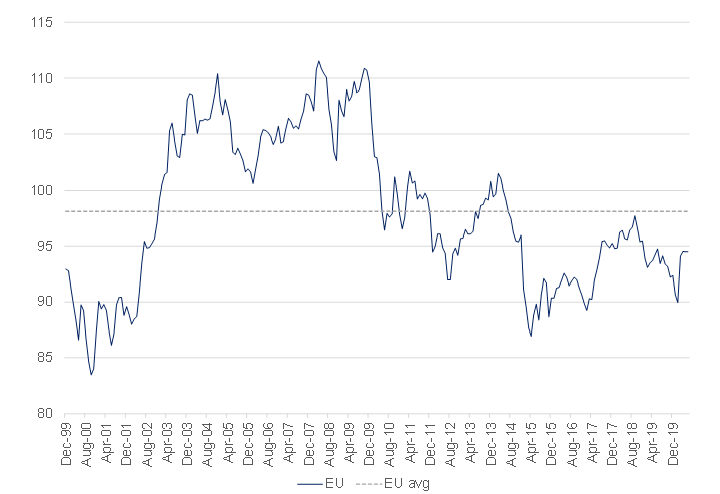
Source: Bloomberg, Anchor
Japanese yen
1.PPP
The Japanese yen is significantly weaker relative to the US dollar than we would have expected, especially given its persistently lower inflation in the face of extremely challenging demographic trends. Japan has led the way in terms of pioneering new ways of providing monetary stimulus, but without being able to achieve meaningful inflation. Its best hope of PPP reducing the tailwind to its theoretical currency strength is perhaps in the form of other major DMs also failing to stimulate inflation.
Figure 23: Japanese yen vs its expected PPP trajectory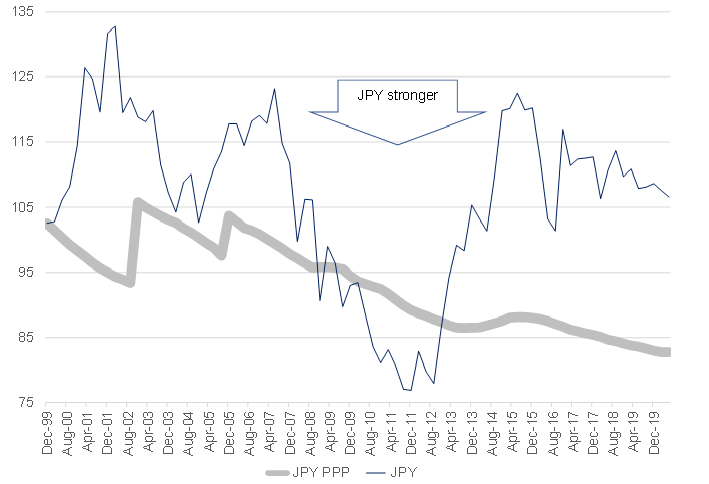
Source: Bloomberg, Anchor
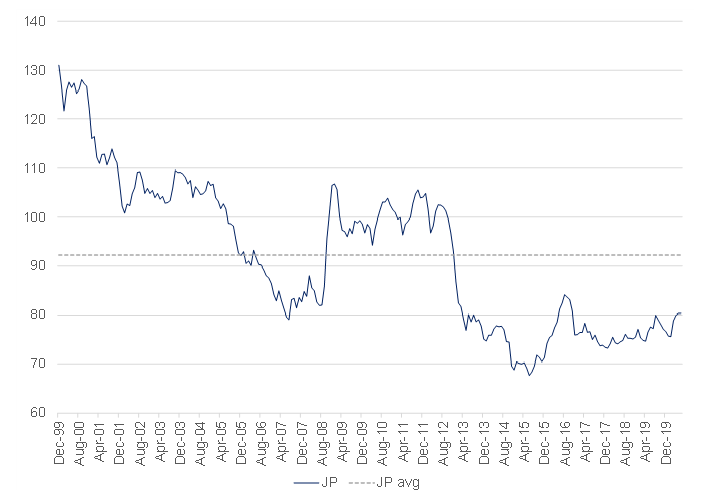
2. REER
Japan is one of the most undervalued major currencies based on fundamentals, with its current REER c. 13% below its 20-year average. While its aggressive monetary stimulus has failed to ignite meaningful inflation, its relentless foreign reserve accumulation has ensured its currency has remained weaker than its fundamentals would suggest for most of this century.
Figure 24: Japanese yen REER
Source: Bloomberg, Anchor
British pound
1.PPP
We would have expected the British pound to strengthen against the US dollar for the first decade of this century and then weaken for the most recent decade (as the only major DM currency to have marginally higher inflation than the US for the past 10 years). It largely followed that path but for the massive Brexit-induced weakening in 2016, which has left the pound significantly weaker than its inflation equilibrium would have suggested.
Figure 25: British pound vs its expected PPP trajectory
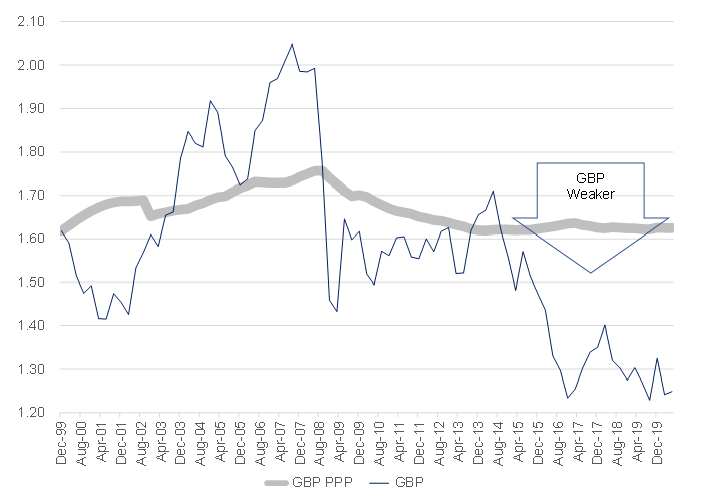
Source: Bloomberg, Anchor
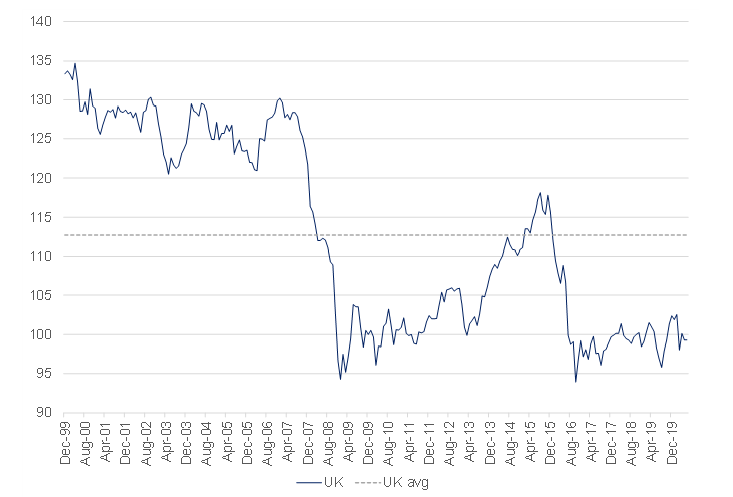
2. REER
The Brexit “adjustment” in 2016 has left the British pound approximately 12% undervalued relative to its 20-year average REER. While a weaker currency should act as economic stimulus for a country which exports less than it imports, the additional currency volatility perhaps threatens its status as a major reserve currency and global capital market hub.
Figure 26: British pound REER
Source: Bloomberg, Anchor
Swiss Franc
1.PPP
The Swiss franc is stronger vs the US dollar than even its extremely low relative inflation would have suggested. Negative interest rates have helped it fight its way back towards fair value, but its status as a haven currency has seen it strengthen away from that trend in the last few months. Its favourable demographics and robust economy give it a realistic chance of achieving moderate inflation and is perhaps its best shot at slowing its PPP-inspired strengthening.
Figure 27: Swiss franc vs its expected PPP trajectory
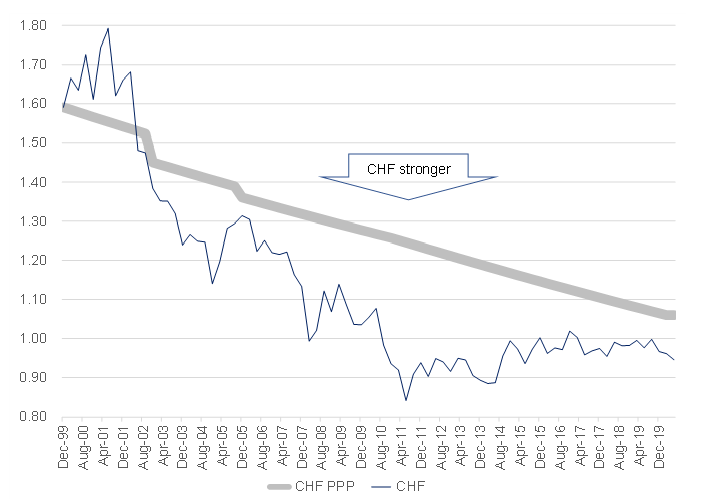
Source: Bloomberg, Anchor
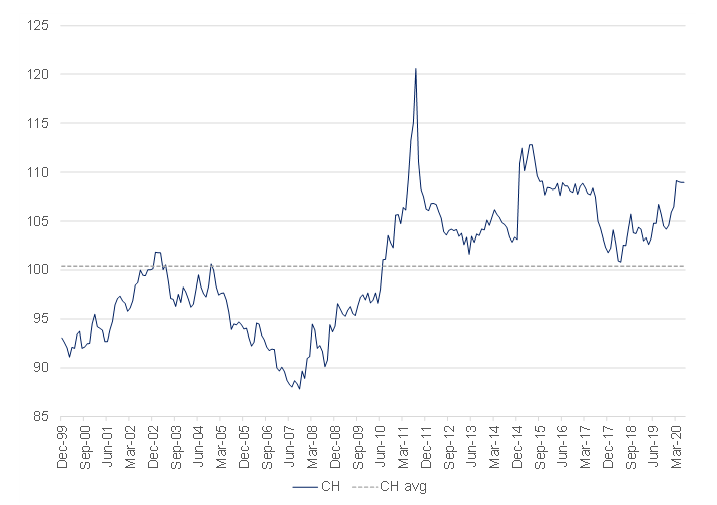
2. REER
The Swiss franc is about 9% overvalued relative to its 20-year REER average, with Switzerland’s aggressive intervention in the currency markets between 2011 and 2015 going some way towards pulling the Swiss franc’s valuation back a bit. Its status as a prudently run, neutral territory should result in Switzerland continuing to see its currency serve as a safe port in a storm and its failed experiment with a euro peg should give investors additional comfort that upside will not be capped.
Figure 28: Swiss franc REER
Source: Bloomberg, Anchor
Conclusion
- USD: Its status as the global reserve currency seems safe for the foreseeable future, though this is unlikely to support its valuation. The greenback is slightly overvalued on a fundamental basis (perhaps by 5%–10%), with almost half of that coming from its recent rally as investors fled to safety. Aggressive fiscal and monetary stimulus might spook investors but, relative to the size of its economy, nothing it is doing stands out relative to its peers. While it has lost some of its relative carry advantage with recent monetary stimulus, it remains more attractive than its peers. Longer term, its favourable demographic trends are losing steam, which might see it give up some of its growth and inflation advantages relative to its peers.
- EUR: The euro maintains its status as the most viable reserve currency alternative to the US dollar for now. However, it is in distant second place and is likely to lose that spot to the Chinese renminbi over the course of the next decade or so. The biggest risk to the euro remains the possibility of the breakup of the monetary union, with Brexit currently setting out the legal precedent for that potential catastrophe. However, the fledgling monetary union grows stronger with each crisis it averts and the COVID-19 pandemic has provided it with the opportunity to forge a much closer, and much needed, fiscal alliance. It is moderately cheap on a fundamental basis (perhaps by 0%–5%, with much of that coming in the last few months.
- JPY: The Japanese yen is the poster child for experimental monetary policy, having long ago pioneered many of the interventions other central banks are currently trying. It is significantly undervalued on a fundamental basis (by 10%–20%) as the central bank has shown a willingness to persistently intervene in currency markets with little fear of building up enormous foreign currency reserves. The attractive valuation comes with the additional advantage that zero yields are now no longer that punitive relative to the alternatives, though its prospects of strengthening stay capped by Japan’s seemingly insatiable appetite to accumulate foreign reserves in its attempts to maintain currency weakness.
- GBP: The UK’s decision to go it alone leaves it competing with the US, China and Europe (all with economies at least four times bigger than that of the UK) for meaningful global significance as it carves out a new role. Uncertainty around the country’s future relationship with its biggest trading partner (Europe) remains and sees its currency significantly undervalued on a fundamental basis (c. 10%-20%). Uncertainty around its role in the global economy going forward is arguably already priced into the British pound, although the catalyst to remove that uncertainty and unlock value probably remains some distance in the future.
- CHF: The Swiss franc accounts for less than 1% of global foreign currency reserves and the Swiss economy is less than 1% of global GDP, so it punches way above its weight as a “major” currency. Its attraction as a currency alternative primarily reflects its prudent financial management, neutral political stance, and well-developed banking sector. The relatively diminutive size of its economy was on display when it was forced to abandon the currency peg it maintained to the euro from 2011 to 2015 accumulating foreign reserves larger than one year’s worth of economic output in that failed experiment. It is about 10%-15% overvalued, though with a central bank unlikely to be particularly effective in preventing further appreciation. Its economy remains fairly robust, having diversified away from its concentration in banking and it has demographic trends that are significantly better than its major DM peers, which should serve it well into the future.
So, clients wanting to diversify away from the US dollar can be broadly divided into two categories:
- Those expecting a gradual normalisation of the global economy without major disruptions – this group should favour the euro and the British pound.
- Those expecting things to get meaningfully worse before they get better – this group should favour the Japanese yen and the Swiss franc.
In the short term, the direction of those currencies is most likely to be determined by technical factors and temporary, unexpected, events so those recommendations are more related to medium- to longer-term views.
In terms of how to think about sizing currency diversification, assuming that the success of the diversification away from the US dollar is most likely to be measured as the performance relative to US dollar, investors should bear in mind that volatility for those currencies is about 60% of global equity volatility over the longer term (we note that it is currently slightly higher for the British pound [at c. 70%] and slightly lower for the rest [c. 50%]), so position sizing for currency diversification should be framed in that context and measured relative to the investor’s risk appetite. For example, shifting 10% of your portfolio from US dollar to euro is the equivalent, in terms of risk appetite, of adding about 5%-6% equity exposure, while shifting 10% from the US dollar to the British pound is the risk appetite equivalent of adding 6%-7% equity exposure.