Central banks and US corporate earnings drove markets in July. US company results have so far largely exceeded expectations, while central banks struggled to meet high expectations. Strong US earnings helped US equity markets finish the month higher (S&P 500 +1.4%) and dragged global developed market (DM) equities into positive territory for the month (MSCI World + 0.5), despite negative US dollar returns from most other major markets. DMs outperformed emerging markets (MSCI EM -1.2% in July) for the sixth consecutive month.
Two-thirds of S&P 500 companies reported earnings in July and the FAANG stocks (Facebook, Apple, Amazon, Netflix and Alphabet’s Google) were back delivering positive surprises as these counters ended the month up over 4% in aggregate, with Alphabet leading the way (+12.5% for July) as it bounced back from a disappointing 1Q19. Amongst the FAANGs, Netflix was the only major disappointment (-12% in July) as a drop in its US subscribers caught investors by surprise. US banks also had a strong month as robust consumer credit growth helped offset interest margin pressure coming from lower rates.
Mario Draghi has just two more European Central Bank (ECB) meetings to chair before he hands over to his likely successor, Christine Lagarde, in November. At the July ECB meeting, he suggested that he may cut European interest rates further into negative territory before his term is over and didn’t rule out restarting quantitative easing (QE) as a robust domestic economy was being threatened by external factors putting pressure on manufacturing and export businesses. Going into that ECB meeting, an index of German business expectations showed companies were the most pessimistic they’ve been in over 10 years. Across the Atlantic, US Federal Reserve (Fed) Chair Jerome Powell delivered a much-expected 0.25% rate cut – the first since December 2008. However, it accompanied a less dovish message, which suggested that it was just a “mid-cycle adjustment” for an economy that was still being driven by a solid consumer and this was at odds with market expectations that there were at least a couple more interest rate cuts to come. The Fed surprise caused the US dollar to rally (Dollar index +2.5% in July), leaving it stronger against most currencies, particularly the British pound (-4.2% in July) as Boris Johnson took over as UK prime minister with a message that he’s not afraid of a hard Brexit in October.
How is the S&P 500 performing under a Trump presidency?
US President Donald Trump continues to boast about the S&P 500 Index’s strong performance since his election, so we looked at how his term is panning out (for the S&P 500) vs other US presidents over the past 90 years (the period for which we have S&P 500 data available). During that time the US had 15 presidents. To test how the S&P 500 fared during each president’s term(s), we measured the index’s performance since a president’s inauguration up to the date of the next president’s inauguration. We highlight that this may not necessarily be 100% technically correct as the market is likely to start moving from the day on which election result are announced, which does complicate the start date since information was not quite as immediately available in the past as it is now.
Trump is in the top half of this class, but his term is by no means a strong outlier. The three outliers are Roosevelt, Eisenhower and Obama. But, again, we note that history was on their side as each of these presidents took the reins after a dismal market performance due to global events (Eisenhower – World War II, Roosevelt – the Great Depression and Obama – the Global Financial Crisis). Nevertheless, even excluding those three, Trump’s performance thus far is similar to what can only be described as an average group. (See Figure 1, which shows that Hoover especially got the short end of the stick)
Figure 1: S&P 500 performance under Trump vs past presidents
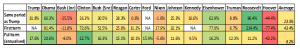
Source: Bloomberg, Anchor
The average return for the first term of a US president is 43.4% (Figure 1) and it is likely that Trump will see that as a minimum target from his current 32% return performance. He has already played his fiscal card and is pressurising the US Federal Reserve (Fed) to cut rates, which means he is running out of options to stimulate the economy. Nevertheless, it will be interesting to see which cards he will play next to help boost the S&P in order to have a strong story to tell going into the 2020 election campaign.
Figure 2: The S&P 500 Index’s performance under various US presidents (by days in office), %:
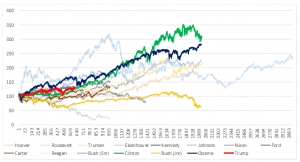
Source: Bloomberg, Anchor