JP Morgan released 1Q20 results on Tuesday (14 April). We note that these results only included one month (March) affected by the COVID-19 pandemic. So, although the result was solid, albeit slightly below expectations, 1Q20 wasn’t particularly revealing when considering the current global economic slowdown. The key variable in the result was an increase in the reserve build (i.e. the provision for future credit losses). At $6.8bn, this was a significant number and is likely to be bigger in 2Q20.
We expect that JP Morgan will see a decline in earnings in 2020. The current tangible book value (TBV) is $60.71 and the share price was at $94 on Tuesday. This gives a P/TBV of 1.55x. Life will be tough for the banks if interest rates stay low for a long period and if write-offs rise sharply due to an extended pandemic. However, we highlight that JP Morgan is a well-diversified business which means that it relies on net interest income for half of its revenue. It also has certain cost levers to pull – including increasing the use of technology to reduce staff numbers. In addition, its ROE is likely to recover after 2020 to a more normal level as the increase in credit reserves ebbs. At current share price levels, we would be happy to invest more money in this excellent bank.
At present, US banks are in a very different position to when the global financial crisis (GFC) struck in 2008. These banks have far more liquidity and are a lot less leveraged (JP Morgan’s CET1 ratio was 7.0% at the end of 2008 and stood at 12.4% at year-end 2019). So, unless this pandemic continues for an inordinately long period, we believe there is limited risk that the well-run banks will run into difficulty.
The large US banks have also been over-earning in recent years compared to their long-term averages, largely because the credit environment in the US has been so benign. Write-offs have been below long-term averages for some time. The fact that JP Morgan produced a return on tangible common equity in FY19 of 19% vs a medium-term target of 17% is evidence of this over-earning (in 1Q20 this number was at 5%). As investors, we haven’t been too concerned about this because bank shares have been very modestly priced – and were trading at an unusually large discounts to the overall stock market even before the pandemic started.
JP Morgan 1Q20 results saw a reserve build of $6.8bn for future credit losses. Much of this build related to the consumer business (largely credit card loans) and a smaller portion related to corporate loans (including oil and gas). Investors should note that a new regulation, introduced on 1 January 2020, and covering credit reserves has probably boosted this number materially (currently expected reserve losses [CECL] replaces the old method of credit reserving based on customers actually defaulting on payments). Without going into too much detail, the new regulation basically means that potential credit losses are now recognised much sooner than before, even if these losses don’t actually materialise. This regulation does also mean that bank earnings will be conservatively struck for the next few quarters if economic forecasts remain dire (as at 31 March 2020, JP Morgan assumed unemployment would increase above 10%, and GDP would drop by 25% in 2Q20, and provided for credit losses accordingly).
However, 2Q20 is likely to see a larger increase in the reserve build (also due to CECL). This is based on JP Morgan’s updated (i.e. completed AFTER 31 March 2020) 2Q20 economic forecasts for an unemployment rate of 20% and a drop in GDP of 40%.
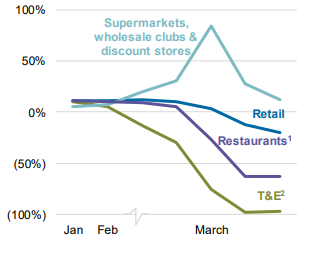
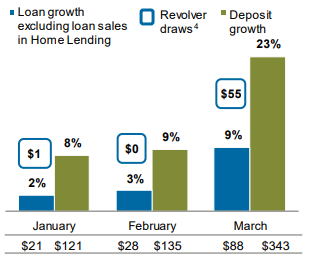
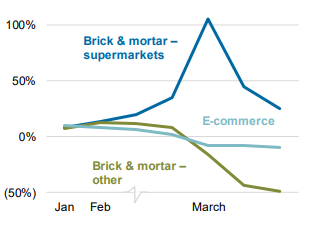
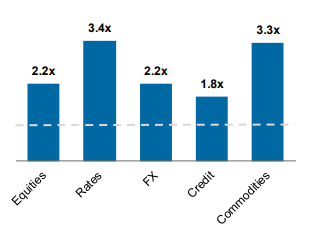
For your interest, this is what happened to banking activity at JP Morgan in March:
- Credit card spend dropped 13% YoY (spend was solid in supermarkets and ok in e-commerce, but was down by 50% in other brick-and-mortar retailers);
- Companies dashed for cash by raising bonds/loans and putting the cash on their balance sheets; and
- Equity/forex/commodities’ trading volumes rose sharply.
Figure 1: JP Morgan March activity – debit and credit card sales volume, YoY

Source: JP Morgan Chase. 1. Restaurants includes quick serve restaurants
Figure 2: JP Morgan March activity – EOP loan and deposit growth YoY, $bn

Source: JP Morgan Chase. 4. Represents increases in retained loans on revolving commitments in JPM’s Wholesale businesses.
Figure 3: JP Morgan March activity – Merchant processing volume, YoY

Source: JP Morgan Chase
Figure 4: JP Morgan March activity – peak vs January average trading volumes

Source: JP Morgan Chase


