India background: An awakening giant
India is one of the world’s fastest-growing major economies, with its lead over China widening. The Organisation for Economic Cooperation and Development (OECD) and the IMF are expecting 7.5% YoY GDP growth for India by 2020 vs a forecast of 7.25% YoY in 2019 (according to May 2019 OECD data). Meanwhile, China’s economic growth is forecast at c. 6.0% (and 6.1% by the IMF) for 2020 as the escalating trade war with the US takes its toll.
Figure 1: GDP growth, 2018-2020
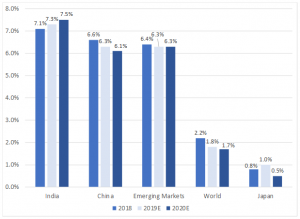
Source: IMF WEO April 2019, Anchor
All of this is good news for India as a future economic powerhouse with factors such as accommodative monetary policy, aided by higher domestic demand, fiscal stimulus (including new income support measures for rural farmers and some recent structural reforms), contributing to the impressive 2019 and 2020 forecasts The appreciation of the Indian rupee (INR) is also expected to reduce inflationary pressures and the country’s current account deficit.
India faced several economic challenges during Prime Minister Narendra Modi’s first term in office including bad debt issues at public sector banks and a chaotic time during its demonetisation episode (when cash shortages led to street protests). However, overall, Modi and his Bharatiya Janata Party (BJP) has provided a steady hand in government, delivering five consecutive years of economic stability, which has seen firm growth and moderate inflation. We expect Modi and the ruling BJP’s recent strong win at the polls to see a continuation of his reforms and sound macroeconomic policy over the next five years.
However, key challenges for Modi also remain including driving reforms in public sector banks (PSBs) and reducing the burden of non-performing loans (NPLs) on their balance sheets, as well as pushing for the transformation of India’s industrial sector through the so-called ‘Make in India’ strategy. This is a major national government programme promoting investment, innovation and skills development, as well as protecting intellectual property and building world-class manufacturing infrastructure in the country.
IHS Markit forecasts that India will become the world’s fifth-largest economy in 2019, reaching a total GDP size exceeding $3trn (overtaking the UK) and by 2025, India’s GDP is set to surpass that of Japan, making India the second-largest economy in the Asia Pacific (APAC) region. Under the Modi government, foreign direct investment (FDI) inflows have surged providing an important boost to India’s external account position and helping create a more dynamic industrial economy. India is also beating China in competitiveness. – over the past four years, it gained 20 points in the World Economic Forum’s Global Competitiveness rankings, while China’s ranking was basically unchanged.
In terms of demographics, India is also foremost among its peer group, including a very young population and low debt levels. Added to that, the labour force addition is 1.5x the country’s peers in the rest of APAC with its working-age population rising c. 13mn p.a. There are c. 7mn new job seekers every year and a c. 50% participation rate in the country’s economy. While the global shift to automation is inherently less labour-intensive (an issue which China didn’t have to contend with 20 years ago, at least not at this scale), we highlight that China’s labour force is shrinking (there are less people in the country’s labour force every year because of its ageing population – in stark contrast to India). A productive economy needs a working-age (young) population to rise above rest of APAC with this young, unemployed population transitioning into a middle-class population grouping by productively putting these young people to work. So, with India’s manufacturing sector gathering momentum, helped by both services and agriculture sectors, consumption demand remains robust in the country making it an attractive investment destination.
Given all the above, we are bullish on India and we believe that, if anything, the bull case for the country has improved since we initially added ICICI Bank to our portfolio.
Figure 2: Key demographic and labour metrics – a bull case for India
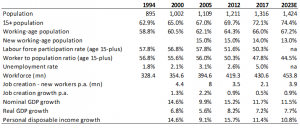
Source: IMF, Census, UN Population database, National Sample Survey Office, Labour bureau
Background to ICICI Bank addition
We added the ICICI Bank American depositary receipt (ADR) to the High Street Equity Portfolio in March 2017. An ADR is a negotiable certificate a US bank issues, which represents a specific number of shares (or one share) in a foreign counter trading on a US exchange.
At the time we added ICICI Bank to our portfolio, NPLs in India’s banking sector were close to peaking – NPLs have since peaked, dropping by c. 75% and being a kicker for that country’s banks. So, we believe that, while India’s banks are still in the process of further reducing NPL burdens on their balance sheets, the sector remains an opportunity for gaining access to the country’s economic growth story.
Despite NPL issues, ICICI Bank has kept improving its retail franchise (which should drive positive underlying earnings progression) in a gradually strengthening operating environment. Valuing it as a retail lender (given its large retail assets and deposits – see below), if asset quality concerns subside, core pre-provision operating profit growth picks up and the return on equity (ROE) improves, then possible upside to the current share price could be material. However, risks to the investment case remain, including the bank reporting higher-than-expected losses due to defaults, regulatory fines, the re-acceleration in NPLs etc.
Figure 3: ICICI Bank’s RoE
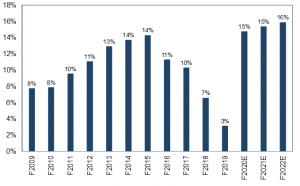
Source: Bloomberg, Anchor
ICICI Bank
ICICI Bank is India’s second-largest private sector bank with a loan book size of INR5.87trn (FY19). As of FY19, the lender had market share of c. 6% in system loans, with a strong distribution network of 4,867 branches. ICICI’s long-term ROE should be c. 15%, we had expected it to trough in 2017, but it reached 3% in 2019. We view the share as a growth stock with the possible upside to current valuations likely to be fairly material.
Figure 4: ICICI Bank’s 5-year share price performance:
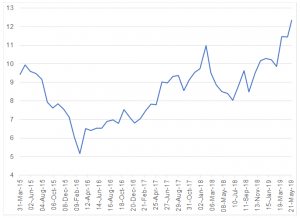
Source: Bloomberg, Anchor
*We note that ICICI has outperformed the Nifty by c. 25% since March 2017 (our entry point in the stock).
ICICI’s 4Q19/ FY19 results
On 6 May, ICICI Bank reported mixed 4Q19 results, recording a 5% YoY drop in standalone profit at INR9.7bn ($140mn) as higher expenses and lower treasury income (vs INR1.0trn [$147mn] in 4Q18) weighed on its quarterly result. However, a strong FY19 overall was driven by solid deposit growth, healthy loan portfolio increases, expansion in ICICI’s net interest margin (NIM) and improved fee income growth. For FY19, core operating profit (before provisions and tax, excluding treasury income) increased 17% YoY to INR220bn ($3.2bn) from INR189.4bn ($2.7bn) in FY18.
Consolidated profit after tax (PAT) in 4Q19 stood at INR11.7bn (c. $169mn) vs INR11.4bn ($165mn) in 4Q18, while FY19 PAT came in at INR33.6bn ($486mn) vs INR67.8bn ($980mn) in FY18. We note that FY18 PAT included gains of INR53.3bn ($771mn) from the sale of shareholding in subsidiaries compared to INR11.1bn ($161mn) in FY19.
The NIM was 3.72% vs 3.40% in 4Q18, as the impact of a INR4.0bn interest received benefit on an income tax refund and interest collection from NPLs on NIMs was c. 25 bpts in 4Q19 vs 18 bpts in 3Q19. The bank’s funding profile has improved over the past few years and even in FY18, as funding costs have gone up, it has been able to raise deposits and not relied on higher-cost funding options. CFO Rakesh Jha said in an interview that, in terms of the increase the bank has seen on funding costs, it has “… been able to pass … on to the lending side. That has meant that we have been able to improve our margins through the year.”
Fee income grew 15% YoY to INR31.8bn (c. $460mn) in 4Q19 vs INR27.5bn ($398mn) in 4Q18 with retail fees constituting 74% of total fees.
We note that NPLs are likely to peak this year with a big drop-off expected next year. Gross NPL formation rose 50% YoY, reflecting an increase on coverage, which we expect to fall sharply in FY20.
Loans and advances were driven by the retail segment and there was a big shift in loan mix due to large consumer demand vs demand from corporates (which increases NIMs). Domestic loan growth advanced 17% YoY (looking ahead, the bank expects loans and advances to grow in the high teens), on the back of a c. 22% jump in retail loans (constituting 60% of its total loan portfolio as at 31 March). We highlight that in India, state-owned banks control most of the market, with ICICI seemingly having the ability to grow cheap loans. Total current and saving account (CASA) deposits rose 16% and 12 % YoY, respectively, while the CASA ratio stood at 49.6%.
Within the retail loan portfolio, mortgage loans rose 19%, auto loans by 8%, business banking by 39% and rural lending by 16% YoY. Commercial vehicle and equipment loans jumped 31% YoY. The unsecured credit card and personal loan portfolio rocketed 43% YoY (this was, however, from a relatively low base and accounted for 7.4% of the overall loan book). The bank said it believes “there are significant opportunities to grow … “ its personal loan and credit card book “ … by mining our customer base for cross-sell and leveraging on the technology partnerships that we have recently entered into.” The credit quality of the personal loan and credit card book continued to remain stable.
Regarding ICICI’s exposure to India’s debt-ridden finance company, Infrastructure Leasing and Financial Services Ltd. (IL&FS), the bank classified INR2.8bn outstanding to IL&FS units as non-performing assets (NPAs). ICICI has INR4.7bn non-fund based exposure to IL&FS. IL&FS defaulted on bank loan payment obligations (including interest), term and short-term deposits to lenders and failed to meet commercial paper redemption obligations that were due on 14 September 2018, triggering panic in the markets
Regarding costs, ICICI’s operating expenses rose 19.6% YoY in 4Q, with the cost-to-income ratio at 44.5% in the quarter (vs 49.9% in 4Q18). In terms of asset quality, the percentage of gross NPAs eased QoQ to 6.7% vs 7.75% in 3Q19 and 8.84% in 4Q18. QoQ, the percentage of net NPA improved to 2.06% from 2.58% (vs 4.77% in 4Q18). The bank noted that NPA additions were expected to stabilise going forward.
Core operating profit grew 26% YoY to INR60.8bn (core pre-provision operating profit rose 15% YoY). Treasury income in 4Q19, however, plummeted 94% YoY to INR1.6bn or $22.4mn (from INR26.9bn [$388mn] in 4Q18) resulting in the operating profit declining to INR62.3bn vs INR75.1bn on a yearly basis. We note that Treasury income in 4Q18 was substantially higher due to gain of INR33.2bn ($480mn) on the sale of shareholding in ICICI Securities.
Net interest income (NII) jumped 27% YoY (4Q19 NII includes INR4.1bn [$60mn] of interest on an income tax refund) to INR76.2bn ($1.1bn) from INR60.2bn ($871mn) in 4Q18.
ICICI declared a dividend of INR1/ share.
On a standalone basis, the bank had a CET-1 ratio of 13.64%, Tier-1 capital adequacy ratio of 15.09% and total capital adequacy ratio of 16.89% as at end-March 2019.
ICICI is trading at c. 2.4x book, so it’s fairly valued in our view (we note though that the book value has not moved much over the past 4 years or so [or since we acquired the shares in March 2017]). We view the bank as a proxy for growth in India and we would advocate maintaining our portfolio exposure to ICICI Bank.