With inflation dominating financial headlines both locally and across the globe, it seems an opportune time to take a closer look at the basic theory of inflation and the current inflationary status quo to better understand the impact for financial markets and investors alike.
What is inflation and how is it calculated?
Inflation is the persistent increase in prices over time. If the price levels of products or services increase in a single jump but does not continue rising, then an economy is not experiencing inflation. An increase in the price of a single product, or in relative prices of some goods, is also not inflation. Inflation is present in a country’s economy when the prices of almost all goods and services are increasing at the same time. Thus, inflation erodes the purchasing power of a currency.
In addition, inflation favours borrowers at the expense of lenders because when the borrower returns the principal to the lender, it is worth less in terms of goods and services (in real terms) than it was when it was borrowed. Inflation that accelerates out of control is referred to as hyperinflation, which can destroy a country’s monetary system and bring about social and political upheaval (for example, as witnessed recently in Zimbabwe and in Germany after World War 1).
The inflation rate is the percentage increase in the price level, typically compared to the prior year i.e., YoY. Analysts can use the inflation rate as a business cycle indicator and to anticipate changes in a country’s central bank monetary policy. Most central banks aim to keep inflation within some target range. Disinflation refers to an inflation rate that is decreasing over time but remains greater than zero. A persistently decreasing price level (i.e., a negative inflation rate) is called deflation. Deflation is commonly associated with deep recessions. When most prices are decreasing, consumers delay purchases because they believe that they can buy the same goods cheaper in the future. For businesses, deflation results in decreasing revenue and increasing real fixed costs.
To calculate a rate of inflation, countries use a price index as a proxy for the price level. A price index measures the average price for a defined basket of goods and services and the consumer price index (CPI) is the best-known indicator for inflation across the globe. The CPI basket represents the purchasing patterns of a typical urban household. However, the weightings for the major categories in the CPI differ by country. For both consumer and producer prices, analysts and policymakers often distinguish between headline inflation and core inflation. Headline inflation refers to price indices for all goods, while core inflation refers to price indices that exclude the typically more volatile food and energy components. Thus, core inflation can sometimes be a more useful measure of underlying trends in prices.
Types of inflation
There are two types of inflation cost-push and demand-pull inflation. Cost-push inflation results from a decrease in aggregate supply, while demand-pull inflation is the consequence of an increase in aggregate demand. Cost-push inflation can result from an initial decrease in aggregate supply caused by an increase in the real price of an important factor of production, such as wages or energy. Demand-pull inflation can result from a rise in money supply, higher government spending, or any other change that grows aggregate demand. It is interesting to note that, at present, inflation pressures across the world are being driven by both cost-push and demand-pull factors.
What does inflation mean to a country’s economy and why do central bank’s target inflation?
At any point in time, economic agents have an expected rate of future inflation in aggregate. The costs of inflation that is equal to the expected rate are different from the costs of inflation that differs from expectations, with the costs imposed on an economy of unanticipated inflation greater than those of perfectly anticipated inflation.
One effect of high inflation (even when it is perfectly anticipated) is that the cost of holding money, rather than interest-bearing securities, is higher because its purchasing power declines steadily. This will lower the quantity of money that people willingly hold and impose some costs of more frequent movement of money from interest-bearing securities to cash or non-interest-bearing deposit accounts to facilitate transactions. To some extent, technology and the Internet have decreased these costs as the movement of money between accounts has become much easier.
Far more important are the costs imposed on an economy by unanticipated inflation – inflation that is higher or lower than the expected rate of inflation. When inflation is higher than expected, borrowers gain at the expense of lenders as loan payments in the future are made with currency that has less value in real terms. Conversely, inflation that is less than expected will benefit lenders at the expense of borrowers. In an economy with volatile (rather than certain) inflation rates, lenders will require higher interest rates to compensate for the additional risk they face from unexpected changes in inflation. Higher borrowing rates slow business investment and reduce the level of economic activity.
A second cost of unexpected inflation is that information about supply and demand from changes in prices becomes less reliable. For example, suppose that when expected inflation is 5%, a manufacturer sees that the prices of their products have increased by 10%. If this is interpreted as an increase in demand for the product, the manufacturer will increase capacity and production in response to the perceived increase in demand. If, in fact, general price inflation is 10% rather than the expected 5% over the recent period, the price increase in the manufacturer’s product did not result from an increase in demand. The expansion of production will result in excess inventory and capacity, and the firm will decrease production, lay off workers and reduce or eliminate expenditures on increased capacity, for some time. Because of these effects, unexpected inflation can increase the magnitude or frequency of business cycles. The destabilising effects of inflation, either higher than expected or lower than expected because of reduced information content of price changes, impose real costs on an economy.
Inflation and the stock market
Last week, the US released its latest inflation data which, over the past three months, have been increasing significantly. Inflation has been a major issue for the US economy and for the financial regulatory authorities, as it is difficult to approach while US employment remains low. This year, after the financial stimulus introduced by new US President Joe Biden’s administration, economists predicted high levels of inflation due to the pumping of cash into the US economy. The US Federal Reserve (Fed) also commented on this, advising that high inflation is likely, but may not be here in the longer term (i.e., inflation will be transitory) and thus there is no current need for altering monetary policy while unemployment remains high. However, now that inflation has reached over 5%, mainly due to the rise in energy prices, traders have been evaluating what the market reaction is likely to be.
It is not only the US dollar, which is likely to be affected, but also stocks. Last week, we saw quite a large rise in US stock markets after the announcement of a 5% inflation rate. Following the inflation data release, the S&P 500 rose 0.65% within two hours, while the Dow Jones advanced by 0.72% and the tech-heavy Nasdaq gained 1.53%. Overall, the biggest winner for the day was the Nasdaq followed by the Dow Jones.
When we see high levels of inflation, a common side effect is the devaluation of a currency or lowered purchasing power within the economy. This means that shares can become harder to purchase, especially by individuals within the country. Subsequently, this can increase demand amongst foreign buyers as foreign currency may be able to benefit from a more competitive exchange rate. In addition to this, usually when a market sees hyperinflation, the central banks look at different possible methods of controlling the rise in prices. One method is by increasing the federal funds rate (or the repo rate in South Africa [SA]), which means that the Fed is effectively attempting to shrink the supply of money available for making purchases. At the same time, this also makes other investments, such as savings accounts and fixed deposits, more attractive due to the increase in their investment yield.
Furthermore, an increase in interest rates can alter investors’ spending and investing habits due to the higher cost of living it entails. Individual investors are impacted through increases to their credit card, overdrafts, and mortgage interest rates, especially if these loans carry a variable interest rate and have not been fixed for the longer term. When the interest rate for credit cards and mortgages increases, the amount of money that consumers can spend decreases. As a result of this, certain groups may avoid investing, or generally spending extra capital. This will not only affect the direct demand of the stock market, but also the sales figures and company revenues.
It is important to note that correlations should be considered when analysing the market, whether the currency exchange market or the stock market. It should also be highlighted that those correlations are not always as strong and can have different effects depending on the overall market. For example, in SA (and other countries across the globe), stock markets are witnessing very high unemployment, lockdowns, and economic restrictions – aspects of the market we have not previously witnessed. For this reason, it is also important to evaluate overall stock market conditions and sentiment. This can be done through analysing not only individual stocks, but indices such as the S&P 500, the NASDAQ, Dow Jones, FTSE JSE All Share Index, etc.
Inflation and fixed income:
Inflation is a bond’s worst enemy. Inflation erodes the purchasing power of a bond’s future cash flows. Put simply, the higher the current rate of inflation and the higher the (expected) future rates of inflation, the higher yields will rise across the yield curve, as investors will demand this higher yield to compensate for inflation risk.
Inflation (as well as expectations of future inflation) are a function of the dynamics between short-term and long-term interest rates. Worldwide, short-term interest rates are administered by nations’ central banks. In the US, the Fed’s Federal Open Market Committee (FOMC) sets the federal funds rate. Historically, other dollar-denominated short-term interest rates, such as LIBOR or LIBID, have been highly correlated with the fed funds rate (or in SA, the JIBAR to the SARM’s repo rate).
Central banks do not control long-term interest rates. Market forces (supply and demand) determine equilibrium pricing for long-term bonds, which set long-term interest rates. If the bond market believes that the central bank in question has set the fed funds rate too low, expectations of future inflation increase, meaning that long-term interest rates increase relative to short-term interest rates – the yield curve steepens.
However, if the market believes that the central bank has set the fed funds rate too high, the opposite happens, and long-term interest rates decrease relative to short-term interest rates – the yield curve flattens. The timing of a bond’s cash flows is important. This includes the bond’s term to maturity. If market participants believe that there is higher inflation on the horizon, interest rates and bond yields will rise (and prices will decrease) to compensate for the loss of the purchasing power of future cash flows. Bonds with the longest cash flows will see their yields rise and their prices fall the most.
The current US inflation environment
The Fed concluded its June two-day meeting on 16 June and the FOMC maintained the benchmark rate at c. zero as was broadly expected. Similarly, the Fed’s 2021 inflation forecasts crept a little higher (in line with expectations), albeit not meaningfully so. However, most market participants were caught off guard by the Fed signalling that there could be two rate hikes in 2023. The main surprises for us were that the Fed seemed to have pulled the expectation of its first rate hike forward from early 2024 to 3Q23 in its dot plot estimates of future rates. At the post-meeting press conference, Fed Chair Jerome Powell indicated that initial discussions around when the Fed should talk about tapering bond purchases have now started. Here it is worth noting that when making interest rate decisions, PCE (personal consumption expenditure) is the Fed’s preferred inflation measure.
We find it telling that the Fed’s inflation forecasts have not risen meaningfully. Instead, the Fed continues to hold the view that the US inflation we are currently seeing is being driven by supply bottlenecks and the global unlock post the COVID-19-induced lockdowns. This means that the current bout of inflation is transitory, and the sooner-than-expected rate hikes are, in this context, good news as it implies that the US economy is in a better shape than at the Fed’s previous policy meeting on 28 April. The economy will also be able to come off the life support of bond purchases and low rates sooner than previously expected. This prognosis should be good news for the US economy, which now has a better outlook. Unfortunately, however, financial markets are mourning the fact that the current stimulus measures will be reduced sooner than previously expected. Furthermore, it is worth focusing on the tightness of underlying commodity fundamentals that largely led to the current situation. The very commodity-intensive “greenification of the world” theme is not going away because the Fed dot plot changed. Numerous governments are looking to infrastructure spend to grow out of this mess and again, are not going to reign in these plans post last week’s news
Figure 1: US CPI by select categories, YoY % change
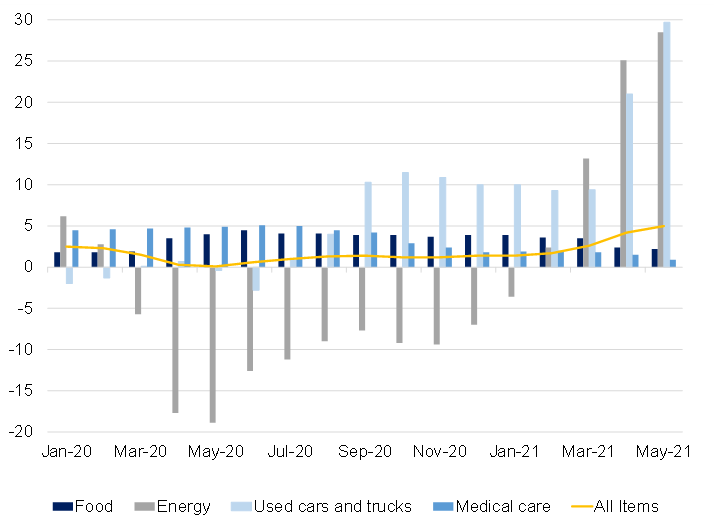
Source: US Bureau of Labour Statistics, Anchor
Figure 2: US headline PCE vs core PCE
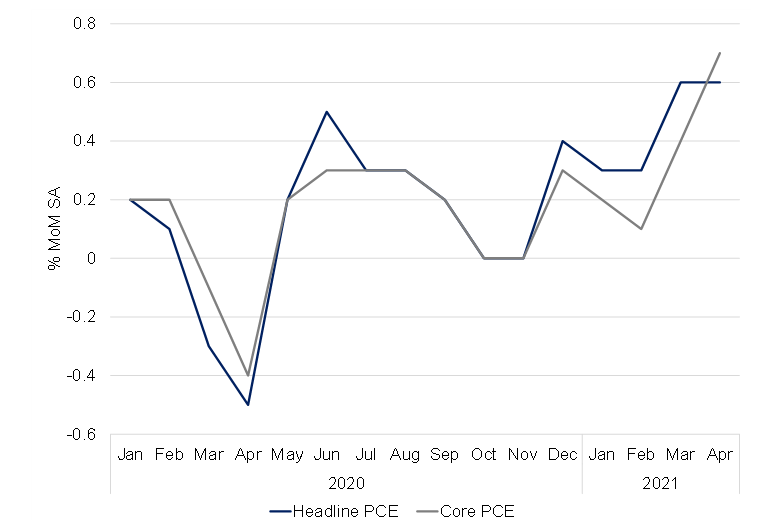
Source: Bureau of Economic Analysis, Anchor
The current SA inflation environment
Currently, at 4.4% YoY for April, SA’s May inflation rate is expected to print at around 5.2%, when the data are released on 23 June. This jump will mainly be due to very strong, adverse base effects, from the slump in inflation a year earlier (in May 2020 – shortly after the implementation of SA’s national lockdown). The rebound in fuel prices, in particular, will have contributed to such a spike in May, with the petrol price dipping to R12.22/litre in May 2020 and recovering to R17.23/litre by May 2021.
A lesser driver of May’s expected inflation spike will be the methodological disturbances in 2Q20 when some spending items were allowed to be sold and/or could not be surveyed by Stats SA’s fieldworkers. However, inflation jumping sharply will likely prove transitory as well – although it will take inflation to above the 4.5% mid-point of the SARB’s inflation target range for the first time since February 2020 (when inflation stood at 4.6%). Still, we foresee an inflation average of around 4.2% YoY for 2021 – comfortably around the middle of the SARB’s target range.
Figure 3: SA inflation, YoY % change
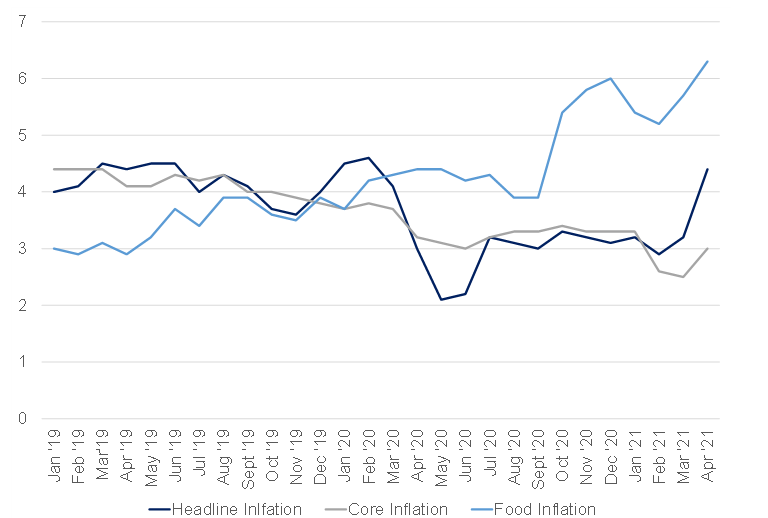
Source: Stats SA, Anchor
Interest rates, bond yields (prices), and inflation expectations correlate with one another. Movements in short-term interest rates, as dictated by a country’s central bank, will affect different bonds with divergent terms to maturity in varying ways, depending on the market’s expectations of future levels of inflation. As it stands, rising inflation and ultimately the need to deal with this via rate hikes remains the economic base case post the unprecedented amounts of fiscal and monetary stimulus that has been pushed into the market (not only in the US, but across the globe).
Looking ahead, the Fed will be very mindful of the “taper tantrum” experience when tailoring its message in future, and the market moves seen recently will reinforce this tendency. We believe that the most likely timing of tapering being announced will still be December 2021 and for the first rate hike to happen in 4Q23. However, much will also depend on the evolution of the pandemic and on how strong growth and inflation are in the interim.