The trade war between China and the US has once again flared up. The opening salvo was (again) fired by US President Donald Trump who implemented a 10% tariff on an additional $300bn worth of US imports from China (starting 1 September). China’s response was swift, with the Chinese government announcing that it will no longer import US agricultural produce especially soybeans.
The US imports c. $600bn of goods from China and up to now half of these goods are subject to tariffs, while China imports $100bn of goods from the US of which most is from the agriculture sector. According to American Farm Bureau data, China imported $9.1bn of US farm produce (mainly soybeans, dairy, sorghum and pork) in 2018 – down from $19.5bn in 2017.
The trade war cycle:
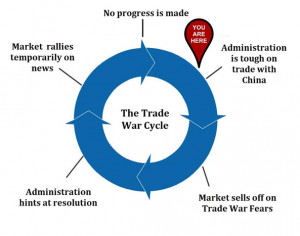
Source: Bloomberg
China also devalued its currency, the renminbi or yuan, by 1.5%. This saw it dropping to its lowest level vs the US dollar in c. a decade, a move that resulted in Trump labelling China a currency manipulator. Buying and selling renminbi is controlled by China’s Central Bank (the People’s Bank of China), which set its daily reference rate at more than CNY6.9/ $1 for the first time since December. In onshore trading, the yuan can trade in a band that can fluctuate 2% on either side of the reference rate – it starts where it closed the previous day (unless the Central Bank intervenes and moves the reference rate) and it can move up or down within the 4% band from there.
On Monday (5 August) US stocks recorded their biggest losses of the year as investors globally scrambled to sell on the back of worries about how much Trump’s escalating trade war will damage the global economy. The US S&P 500 Index dropped c. 3%, – its biggest one-day loss since December 2018, when the US market was in the throes of recession fears. Basically, the index has gone almost nowhere for the better part of two years, while company earnings have seen robust growth.
Nevertheless, YTD the S&P is still c. 13.5% higher (that’s in the context of expectations that S&P EPS will be > 8% higher in 2019) and marginally positive over the past 12 months. With c. 80% of S&P companies having reported results – aggregate earnings growth is up 1.5% YoY for 2Q19, which is about 5% ahead of expectations. So, the current correction is making the market look relatively cheap. Most global markets followed the US’ lead and are down over the past two days. However, the performance of global markets can best be described as painful albeit not terrible.
Figure 2: S&P 500 performance:
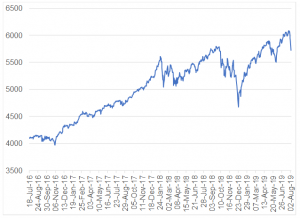
Source: Bloomberg, Anchor
The S&P’s 12M fwd PE is sitting at just over 17x, vs an average over the past 5 years of 17.5x.
On Monday, the yield on the 10-year Treasury, which rises with expectations of stronger economic growth and inflation, dropped to its lowest level since 2016 to 1.75% from Friday’s (2 August’s) 1.85%. Meanwhile, the yield on the two-year note, which is more sensitive to US Federal Reserve (Fed) interest-rate moves fell to 1.58% from 1.71%.
Warning signs of a possible recession also started flashing again, adding to the selling pressure. When short-term Treasury yields are higher than long-term rates, the rule of thumb says a recession could arrive in the next twelve to 36 months and the short-term yield stood at c. 2.00% on Monday – 0.28 ppts higher than the 10-year yield. The last time the Fed was able to use monetary policy to successfully delay a recession after the yield curve had inverted was in 1998. The US Fed then cut rates to avoid a recession and to kick-start growth in the economy.
Closer to home, SA bond yields are also relatively appealing, making SA look attractive and cheap, but we are still waiting for reactions to the latest trade war to die down. The local market is any event expected to take its lead from global markets.
Figure 3: SA bond yields:
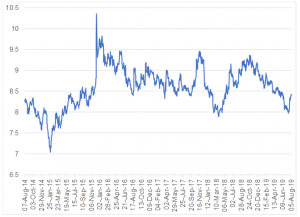
Source: Bloomberg, Anchor