Since late 2020, when the rollout of effective COVID-19 vaccines started, investors have been concerned that demand from normalising economic activity, at a time of unprecedented fiscal and monetary stimulus, will result in runaway inflation (primarily in the US). Inflation itself is not necessarily what scares investors but rather the fact that central banks will need to drain liquidity from the system to fight rising inflation and that will theoretically have dire consequences for asset prices.
Declining yields have forced investors to take on more risk to achieve the same outcome. Below we highlight how investors have been able to achieve a 4% average yield by decade (from the 1990s to date):
- 1990s: Cash (5.2%).
- 2000s: US 10-year government bonds (4.2%).
- 2010s: US investment-grade corporate bonds would not get you there (only 3.2%) and investors would have had to add some junk bonds (6.5%).
- Now: US junk bonds will not get you there (3.9%) and instead it has to be equities?
The above is true even though US inflation has not really changed dramatically over the abovementioned periods (it averaged 3% in the 1990s).
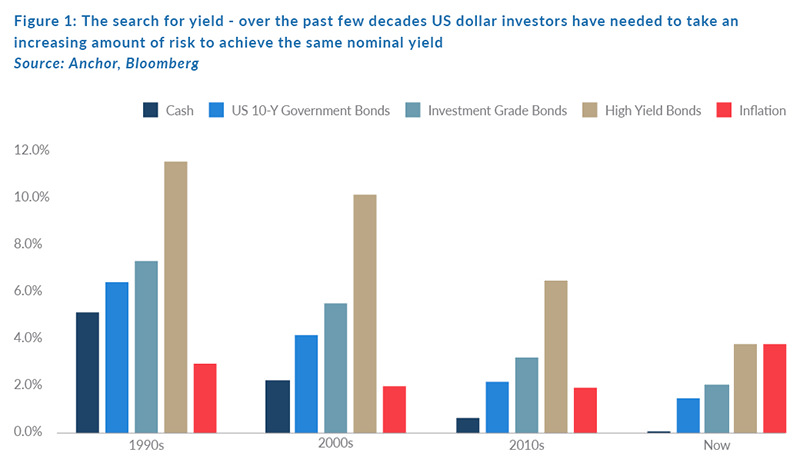
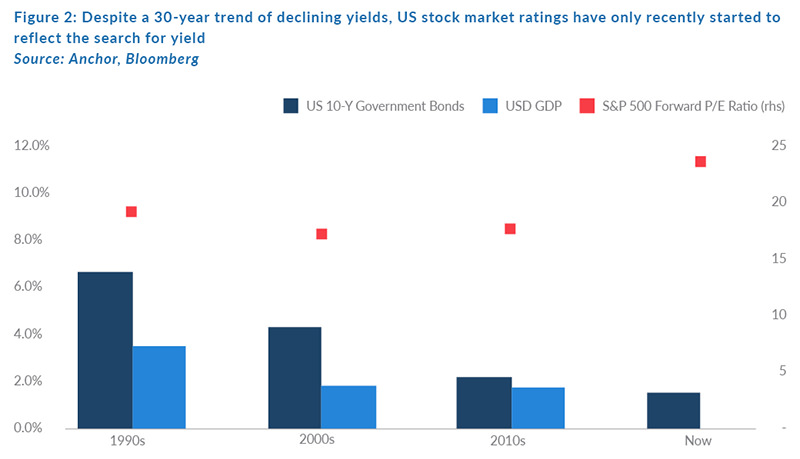
The theory is that, if US monetary policy reverses and drives yields higher, investors can shift back into less risky assets to achieve their investment goals and that reversing the search for yield will put downward pressure on equities, which are trading at above-average ratings.
Ironically, despite the twenty-first century being a tough one to achieve US dollar yields, the price investors have paid for corporate earnings has been below the average price investors paid for those same corporate earnings in the 1990s. This is perhaps because economic growth has also been lower for the past couple of decades.
In this note we briefly explore two questions:
- How likely are we to see persistently higher US inflation?
- How likely are we to see meaningfully higher US rates/yields?
For the purposes of this note, we focus on yields and inflation in the US market, which is not only perceived as the most likely to see higher inflation and yields but is also by far the largest financial market in the world. The US dollar also tends to form the starting point against which most assets are valued, at least for the foreseeable future.
HOW LIKELY ARE WE TO SEE PERSISTENTLY HIGHER US INFLATION?
Inflation forecasts generally fall into three categories:
- Economists – generally qualified professionals using econometric models.
- Consumers – usually based on surveys.
- Market-implied – inflation expectations derived from financial instruments such as inflation swaps or inflation-linked bonds.
Among the abovementioned three categories, only economists have a fair degree of faith in the Fed’s ability to maintain inflation at around its 2% target level for the next few years:
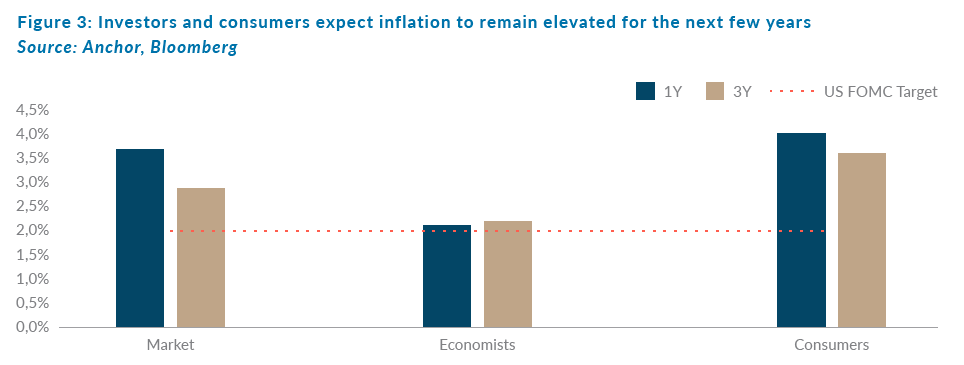
For context though we also highlight the following:
- Consumers have, on average, overestimated inflation by 1% in the twenty-first century (to date).
- Market-implied forecasts of inflation are around 2.5 times more volatile than actual inflation and these forecasts have missed one-year inflation expectations in excess of 1%, more than 20% of the time over the past 15 years.
- Economists tend to be fairly conservative with their forecasts, generally assuming that inflation will remain roughly stable and, as such, their forecasts are around half as volatile as actual inflation.
Below we consider the Fed’s preferred measure of inflation (core personal consumption expenditure [PCE] inflation) and we divide the basket into three main categories:
- Inflation temporarily elevated due to base effects – these are those inflation categories where the pandemic forced big pricing discounts that are now unwinding.
- Inflation temporarily elevated due to supply chain issues – those categories where the pandemic has caused bottlenecks in supply of either goods or labour in certain sectors.
- All other items.
In the two former categories, we believe inflation will be transitory and, as such, will be ignored by the Fed.
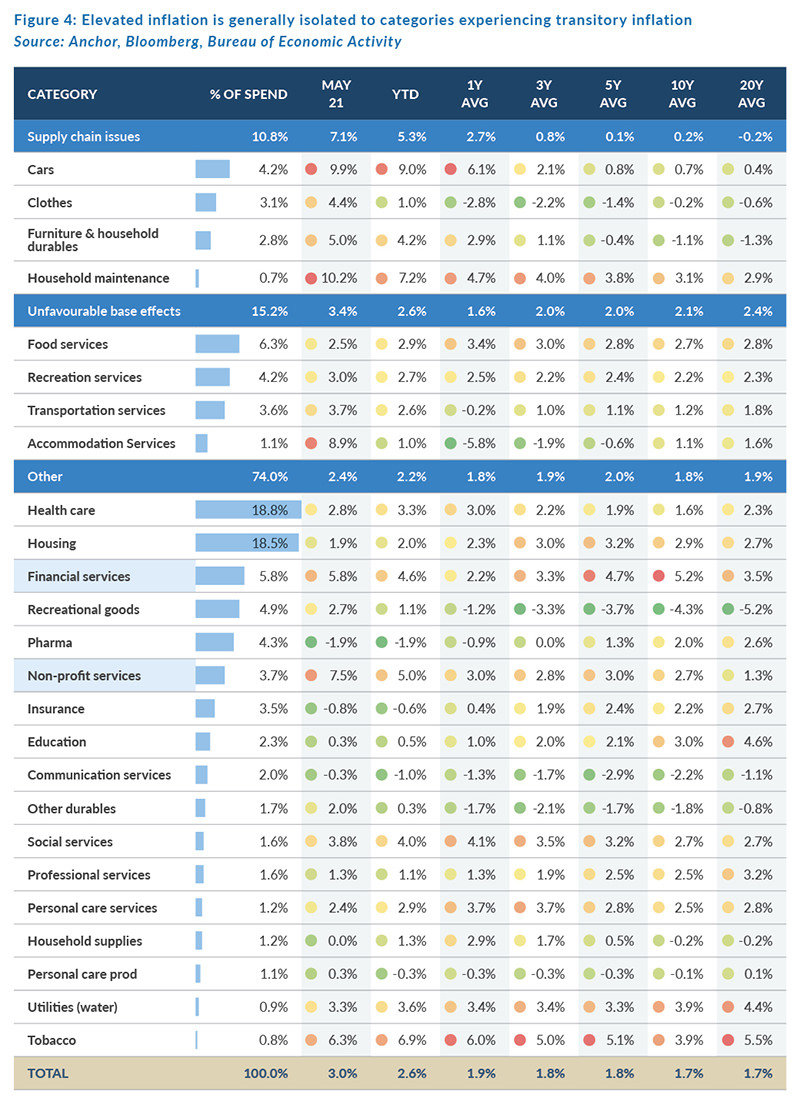
Ignoring those categories that we believe are experiencing transitory inflation, the only other categories where we see concerning US inflation trends are:
- Financial services: Where the biggest component is a theoretical assumption of the implied cost of bank deposits, which is ironically mostly impacted by higher rates. Still, we expect the Fed to ignore this category.
- Non-profit services: Where the biggest component is related to the co-payment Americans make for insured medical claims. This component is too small to lose sleep over and it is generally too complex to come to any meaningful conclusions about its trajectory.
On balance, we are sanguine about the prospect of inflation remaining elevated for extended periods but with two important caveats:
- Inflation is notoriously tricky to forecast!
- Somewhat related to point one, we also note that the medium-term trajectory of inflation is determined to a large extent by psychology – if economic actors believe inflation will be higher, that can become a self-fulfilling prophecy. Think of our own experience in SA, where workers’ base case is that inflation is 6% and they thus expect salary negotiations to kick off at around that level, as do landlords, who have been accustomed to pencilling in 6%-plus annual rental escalations. Businesses pre-empt the cost-push inflation from those two categories and pass that inflation on to their customers and so the cycle perpetuates itself.
HOW LIKELY ARE WE TO SEE MEANINGFULLY HIGHER RATES/YIELDS?
The COVID-19 induced recession was an unusual one in many respects including the depth of the contraction and the pace of the recovery. However, perhaps the most stark for the US economy, which is generally held up as the model of capitalism, was the extent to which the government shouldered the burden of the economic contraction, leaving private sector balance sheets relatively unscathed.
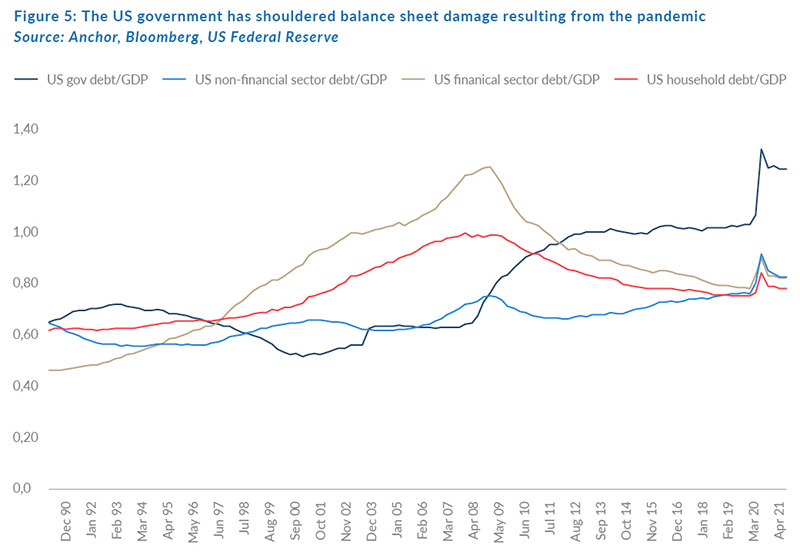
US households and the US financial sector went into this crisis in much better shape than they went into the 2008 GFC, entering the COVID-19 pandemic with 38% and 25% less leverage relative to GDP, respectively. Importantly, they collectively took on negligible additional debt to survive the pandemic, thanks largely to the US government’s efforts. If employment normalises relatively quickly, that leaves the private sector reasonably immune to higher rates. Even non-financial corporates, who have been steadily increasing debt over recent years, entered the COVID-19 crisis with a similar amount of leverage relative to US economic output than they took into the GFC. While these non-financial corporates slightly increased leverage to survive the pandemic, much of that leverage will be in fixed-rate debt and with historically low interest rates, they are (at least collectively) likely fairly immune to higher rates.
The US government, however, is the exception, having more than doubled its leverage relative to the level it took into the GFC and so it is in the context of the government’s dramatically higher leverage that we consider the impact of higher rates. The US as the custodian of the world’s reserve currency (at least for the foreseeable future) has arguably unlimited access to debt, so that is certainly not an imminently limiting factor. It is also likely to want to grow its way out of the additional debt (via higher GDP rather than lower debt) instead of tightening its belt to achieve lower gearing through fiscal austerity. It does though seem reasonable to assume that it has run out of runway to keep US long-term rates artificially low via quantitative easing (QE), with economists now forecasting that the Fed will stop expanding its balance later this year.
However, the Fed is also unlikely to start shrinking its balance sheet anytime soon and, in fact, towards the end of 2019 (about a year into the previous efforts to shrink its balance sheet) the Fed reversed course on the basis of a new theory that it should expand its balance sheet at the pace of nominal GDP just to keep it from tightening monetary conditions. So, with tapering as the most imminent threat to higher funding rates, we compare the current conditions to the last taper tantrum in 2013, when the Fed’s announcement of its intention to stop QE resulted in US 10-year bond yields spiking by over 1%.
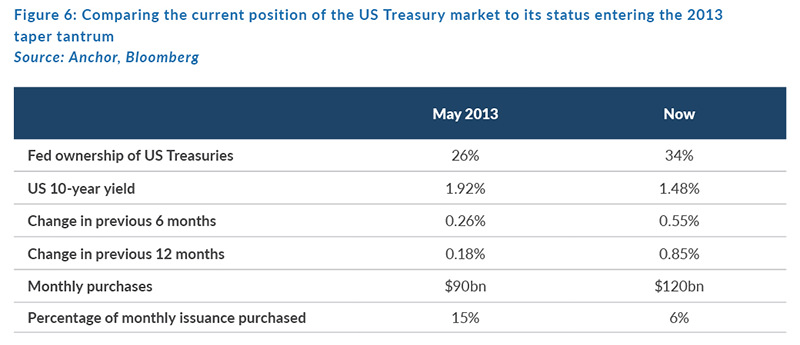
In our view, the biggest positives currently, relative to the 2013 taper tantrum are:
- We have already experienced a Fed taper so there is less uncertainty about what might happen. It is also unlikely that we will see some of the clumsy exit mistakes which we experienced previously.
- The current rate of QE, although larger than in 2013, is absorbing a much smaller portion of new issuances, so the removal of the Fed as a buyer leaves a smaller hole this time around.
- Rates have already backed up by a decent amount (c. 0.85%) in the 6–12 months leading to this taper and thus the market has potentially already pre-empted some of the impact.
Conversely, we believe that the biggest negatives currently, relative to the 2013 taper tantrum are:
- Rates are starting from a lower base this time around; and
- the supply of US Treasuries is almost double what it was in 2013.
CONCLUSION
- We believe that the latest bout of above-average US inflation is likely to be mostly transitory and is unlikely to result in the Fed having to act too aggressively in its response.
- We expect US long-bond rates should drift higher as the Fed tapers QE later this year, but likely at only half of the sell-off we saw in 2013 and at a more subdued pace.
- In our view, the higher rates are unlikely to cause too much indigestion for most categories of US borrowers, who are in much better shape than they were during the GFC.
- The current above-average US stock market multiples are unlikely to come under significant pressure from the slightly higher US rates in the context of those rates still being significantly below the level seen in recent decades. We expect the “search for yield” to moderate as rates drift higher but not to disappear and, as such, it will still provide some support for elevated stock market multiples.


