Going into the year we would’ve probably rated the chances of a computer virus bringing the global economy to its knees higher than that of a flu virus, and we would’ve had both as extremely low probability events! We also wouldn’t have expected OPEC+ (which includes Russia) to start increasing the supply of oil into a massive demand shock, but that’s the world we find ourselves in now. Just to ensure that we’re not too tempted to take the edge off that stark reality, the SA government has also banned the sale of liquor for the next three weeks during the lockdown. Usually, we have some idea of where risks are building in economies, things such as excessive corporate leverage in the current expansion or excessive housing debt in the previous one, but it’s tough to pick the catalyst that turns the tide and exposes those with no pants! Economist Hyman Minsky described the phenomenon of financial cycles as follows: long periods of prosperity result in complacency and an increase in speculative behaviour, typically financed with borrowings that result in debt growing faster than economies until a catalyst (the so-called Minsky moment) causes credit conditions to tighten, resulting in bankruptcies and/or distressed asset sales.
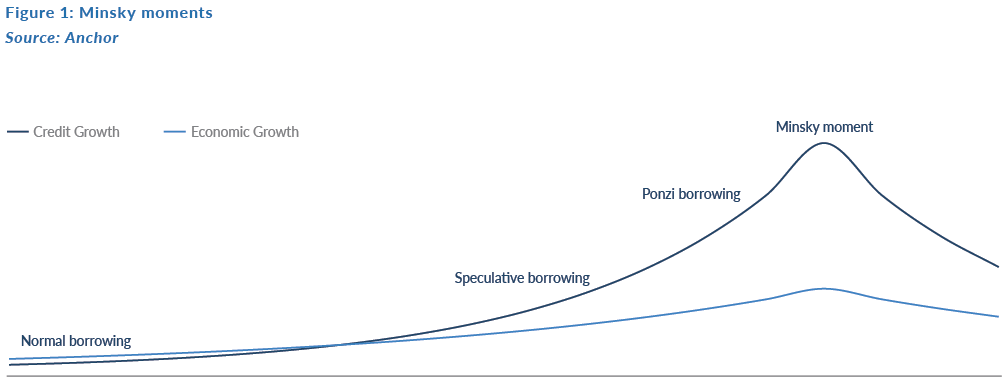
Not many would’ve correctly predicted the demise of 160-year-old investment firm Lehman Brothers as the catalyst for the GFC. The catalyst, though it might be newsworthy, is somewhat irrelevant, since it’s the extent and the duration of the economic consequences that are likely to have the biggest impact on our personal and financial lives. In this note, we explore some potential outcomes for the global economy and compare the sharp moves in asset prices we’ve seen thus far to previous bear markets.
The economic impact
Conventional wisdom suggests that developed markets (DMs), the US in particular, are consumer driven economies and that a pullback in consumer spending is the predominant cause of recessions.
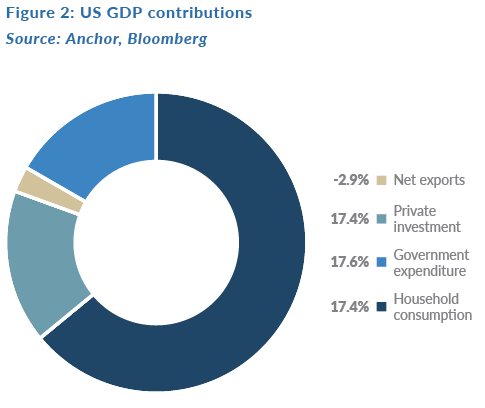
It’s true that household consumption is responsible for two-thirds of US economic output (and a similar portion for most developed and even many emerging markets [EMs]), but experience tells us that it’s a sharp slowdown in the private investment portion of GDP which usually causes most of the economic pain. This, as companies hold off on big capital projects, cancelling or delaying projects to buy transportation equipment (planes, trains, trucks), machinery and IT equipment and the construction of new commercial buildings or houses. In fact, for the past three US recessions a drop in private investment has been comfortably the biggest contributor to shrinking economic output.
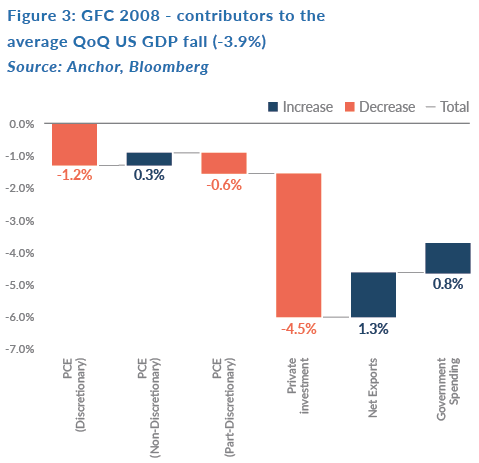
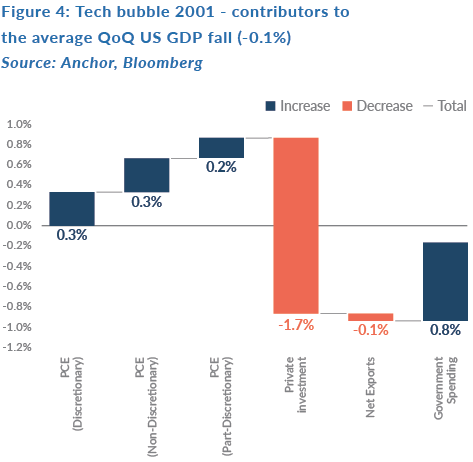
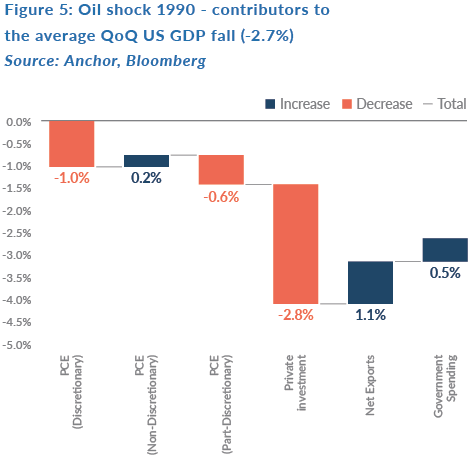
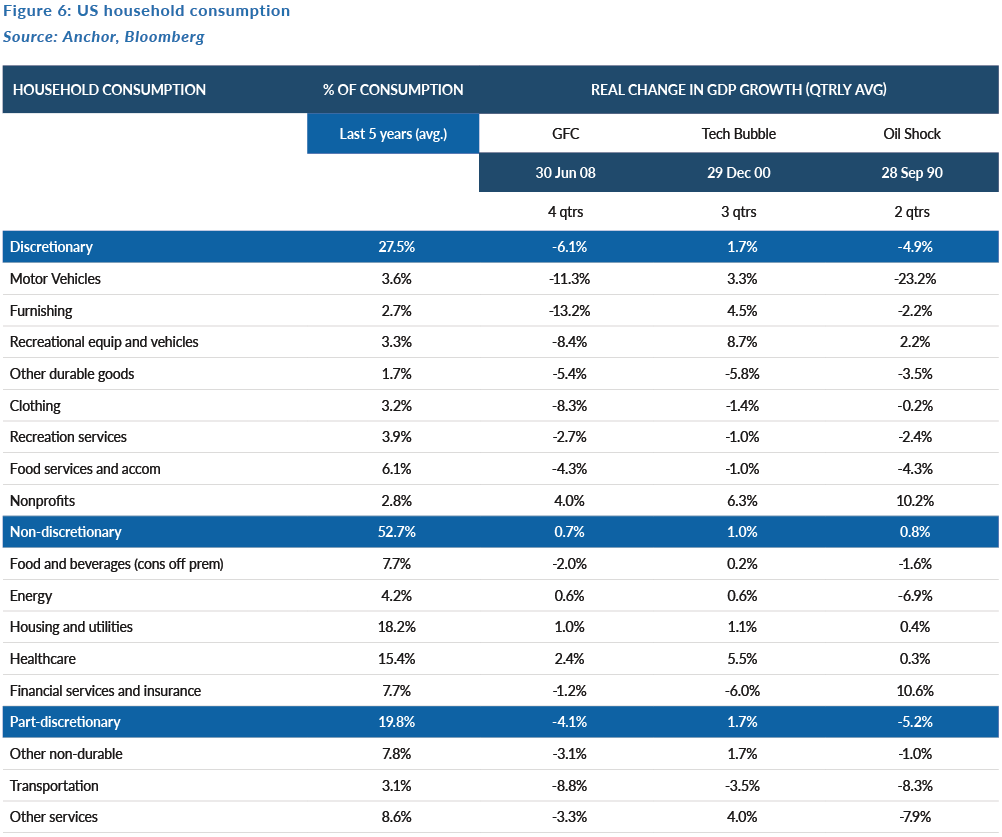
Spending on private investment fell by between 8% and 25% over the course of the past three US recessions. Household consumption spending also tends to drop but with more than 50% of household consumption considered non-discretionary (which tends to grow marginally), the rest (which includes partially or fully discretionary elements) has tended to fall by about 5% (the exception being the tech bubble in 2001, when discretionary spending actually increased).
Economists are almost unanimous that the US, and most of the world, will experience negative economic growth in 2Q20 as movement restrictions imposed to counter the spread of COVID-19 weigh on economic activity. The duration of the economic slump and the speed at which it bounces back is a subject of fierce debate and tends to correlate with the theories on how quickly the spread of the virus can be brought under control. This time, unlike during most recent recessions, it will be the inability of consumers to access various categories of spending (including restaurants, hotels, flights, movies etc.) that will result in a sharp slump in household consumption. Typically, in the past it would have been loss of income and savings or fear thereof which would drive consumers to curtail their spending. Categories of consumption that are inaccessible because of movement restrictions account for upwards of 10% of all US economic expenditure and many could see very little or no spending for a period. This implies the potential of a 10% drop in US GDP (similar to many other economies), depending on the scale of movement restrictions. That is likely to be at least partially offset by other categories of spending, particularly online, that stand to gain from the current restrictions on movement.
Governments and central banks are trying to furiously plug economic holes in an attempt to ensure that companies and individuals have access to grants or loans to tide them over until the situation normalises. The US has recently announced $2trn of fiscal stimulus (the equivalent of about 10% of annual US GDP), which should hopefully make up for much of the pull back in private consumption and investment. If the stimulus can keep companies from declaring bankruptcy, defaulting on debt and laying off workers, then the prospect of a much quicker resumption of normal economic growth remains reasonable. Governments and central banks are patently aware of the importance of confidence in greasing the wheels of the global economy.
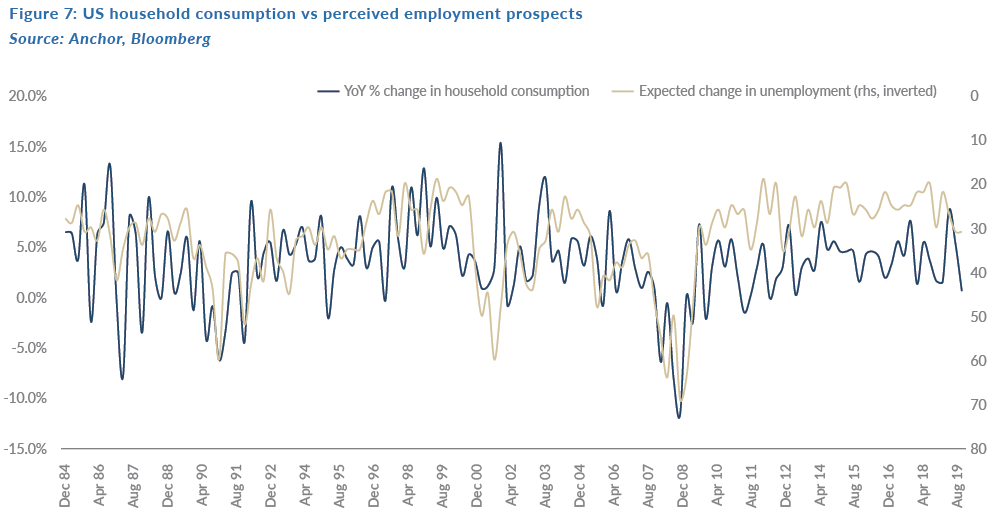
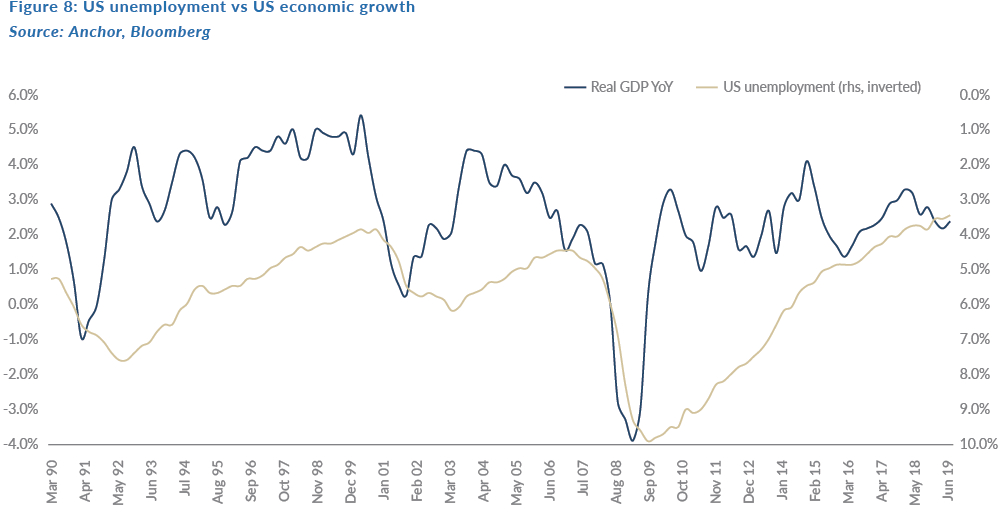
Once consumers start losing their jobs and savings, their propensity to spend less starts a downhill spiral which would require a shift in focus from the easing of movement restrictions (signalling a trough in economic declines), to the need for unemployment to come close to peaking before economic growth can trough (with the base effects allowing growth to bounce back much quicker than employment).
SA’s economy, much like that of the US, is heavily reliant on consumers (60% of economic output vs 68% for the US), but it is slightly more reliant on government expenditure (21% vs 18% for the US). This is positive in the short term from a perspective of cushioning economic shocks, although it is less desirable in the long run.
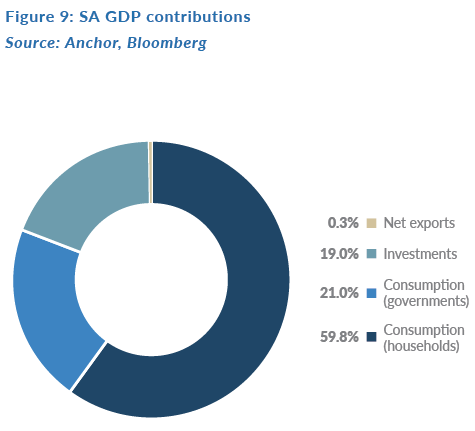
The local economy is much more exposed to the impact of the rand exchange rate through net exports, which tend to have a much larger, and more volatile, impact on local economic growth than is the case for larger DMs. As a large mineral exporter, the impact of inventories also tends to add volatility to SA’s path of economic growth. These two components, largely beyond our control, have had a significant impact (both positive and negative) over the course of the past three SA recessions:


Barring SA’s most recent recession in 2019, drops in consumption and investment have had a similarly negative impact on local GDP growth (subtracting about 2%–3%, in aggregate, from growth during both the GFC and the recession in the early 1990s).
SA tends to have less granular data available for analysing GDP, but it’s unlikely that discretionary categories of spending account for as much of household consumption as is the case in the US. It’s not inconceivable that the categories of spending that are most susceptible to restrictions of movement are in excess of 5% of economic output. Thus, we’re likely to see a relatively large negative GDP print for the quarters hampered by lockdowns. A 5% drop in SA GDP is the equivalent of c. R65bn per quarter, with the government needing to plug at least that gap to avoid the kind of setback that would further exacerbate unemployment.
Bear markets
For investors, recessions not only have an impact on their income prospects but, since recessions typically coincide with bear markets, they also tend to have significant ramifications for the value of their investments. The US stock market started its most recent bear market (defined as a drop of >20% from the peak) on 20 February this year (after the longest bull market in history – almost 11 years!). Mark Twain is credited with the saying “History doesn’t repeat itself, but it often rhymes.” With that in mind, we thought it would be a useful exercise to study how bear markets typically behave, so that we’re mentally prepared for the emotional rollercoaster and are best able to make rational investment decisions – forewarned is forearmed.
We analysed the past 40 years of US equity markets leading up to the most recent bear market, which includes five bull markets and five bear markets. The following three contrasts were stark:
1) Bull markets tend to last about six times longer, with the average bear market lasting slightly more than a year (so we’re about one-tenth of the way in, if the current bear market is equal to the average).

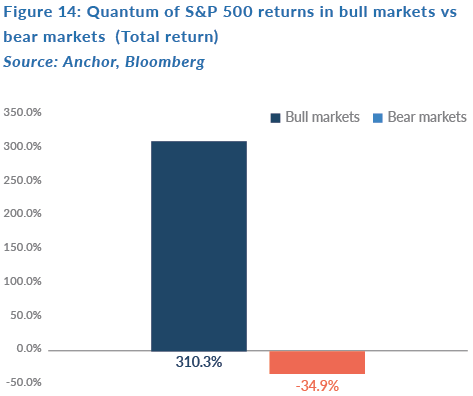
2) The direction of returns are obviously in the opposite directions for bull and bear markets, but the quantum of returns is a multiple of about nine times higher for bull markets, so investors can make around nine times more during bull markets than they would lose in bear markets (the power of compounding and of staying the course!). The S&P 500 is down c. 26% (up to the close on 3 April 2020) since it peaked on 20 February 2020, so we’re about 70% of the way to an average bear market.
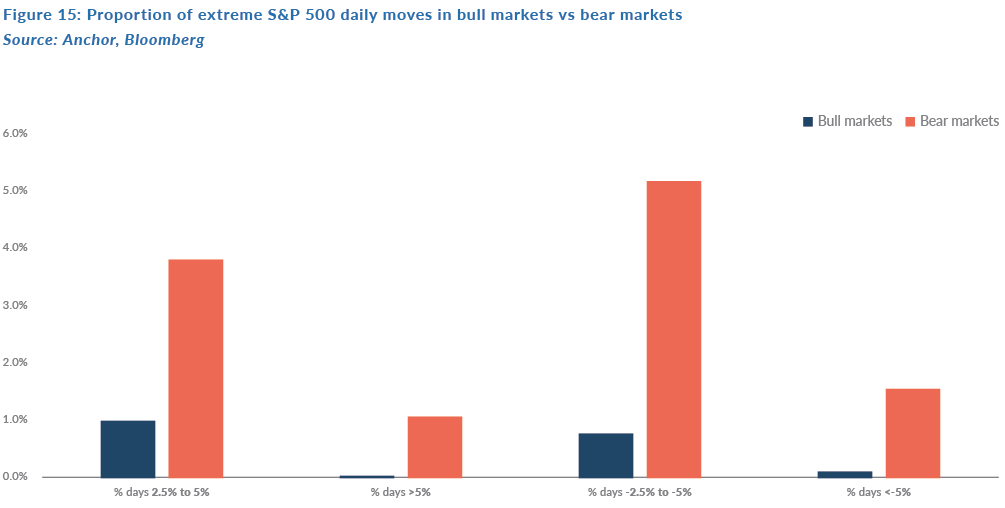
3) The frequency of extreme moves is significantly higher during bear markets, for both big up and down days on markets:
-
- Frequency of up days > 2.5% are five times higher.
- Frequency of down days < -2.5% are eight times higher.
- Frequency of up days > 5% are thirty-four times higher.
- Frequency of down days < -5% are eighteen-times higher.
For the first four weeks of the current S&P 500 bear market, less than 25% of the daily moves have been smaller than 2.5%, and more than 50% of daily moves have been >4% either way.
There are also a couple of ways in which bull and bear markets don’t differ particularly dramatically. These include:
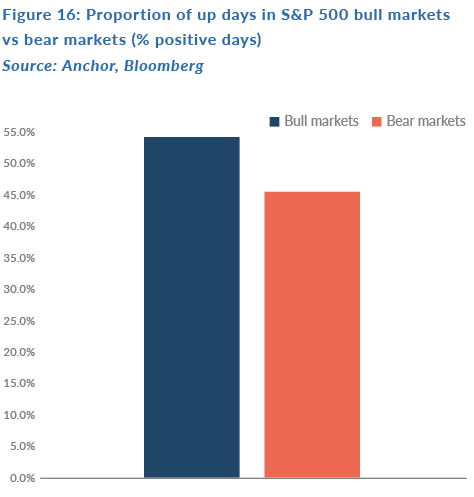
1) Even in bull markets, only slightly more than 50% of daily moves are positive, for bear markets it’s only slightly less than 50% (in the first four weeks of the current bear market, only 35% of trading days have been positive):
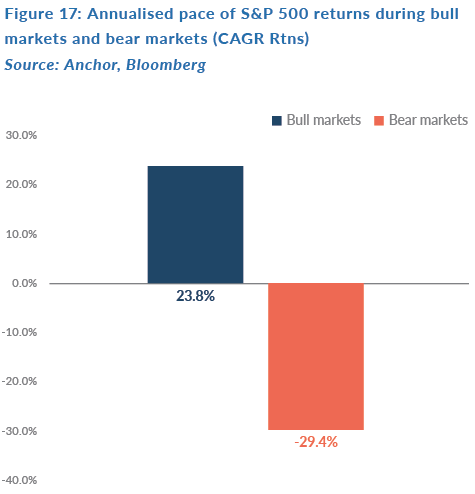
2) Though the adage suggests that markets go up the escalator and down the elevator, the last five bull/bear markets don’t differ that much, with markets going up 24% p.a. on average and coming down by 29% p.a. on average.
We did a similar analysis for the FTSE/JSE All Share Index (ALSI), but data are only available going back 25 years, so we have used that time period for our analysis. The volatile nature of the benchmark means that we end up with eight bull markets and eight bear markets over the period (as many as the S&P 500 has had in 55 years). This includes the current bear market, which started over two years ago when the index peaked on 25 January 2018 (already about three times longer than the average bear market over the past 25 years).
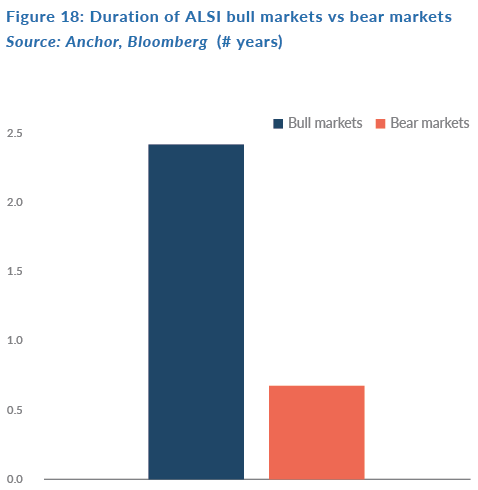
1) ALSI bull/bear cycles are significantly shorter than those of S&P 500 markets, with ALSI bull markets lasting about 3.6 times longer than bear markets (vs six times longer for the S&P 500):
2) The FTSE/JSE All Share Index bull markets have half the relative potency of S&P 500 bull markets, delivering compound returns of about 4.6 times the quantum of bear markets (vs nine times for the S&P 500). The current ALSI bear market, at -25% (up to the close on 3 April 2020), is about 82% of the way to the average ALSI bear-market return over the past 25 years.

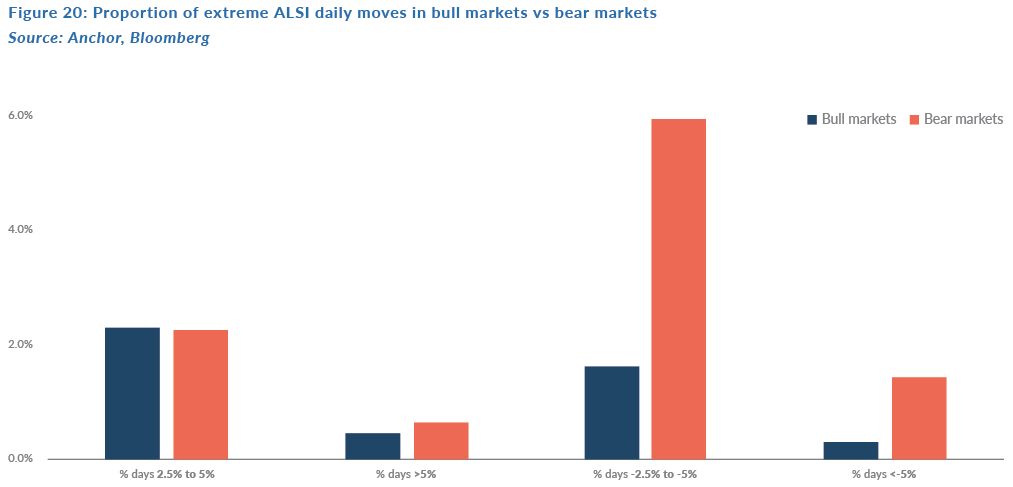
3) The frequency of large daily moves in ALSI bear markets relative to bull markets is not as pronounced as with the S&P 500, particularly when it is relevant to the upside:
-
- Frequency of up days > 2.5% are 1.1 times higher (five times higher for the S&P 500).
- Frequency of down days < -2.5% are 3.8 times higher (eight times higher for the S&P 500).
- Frequency of up days > 5% are 1.4x higher (thirty-four times higher for the S&P 500).
- Frequency of down days < -5% are 4.5x higher (eighteen times higher for the S&P 500).
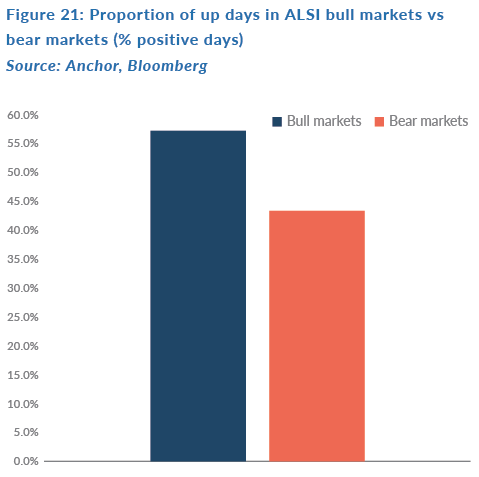
4) The number of positive days in ALSI bull vs bear markets is only marginally more pronounced vs the S&P 500 (56% of positive days in bull markets for the ALSI vs 54% for S&P 500 and 44% vs 46% in bear markets, respectively):
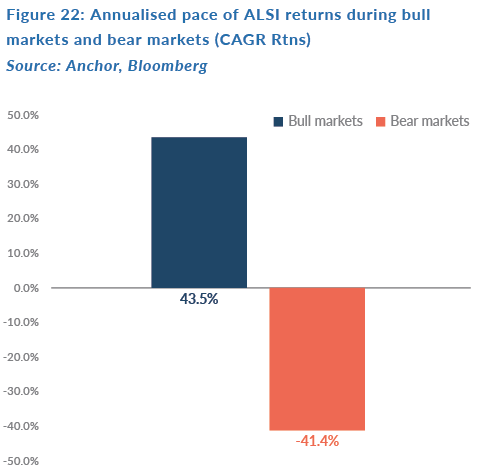
5) The adage about markets going up the escalator and down the elevator certainly doesn’t ring true for the ALSI, which moves at a similar annualised pace of returns on the way up and on the way down (which is > 50% faster than the S&P 500 pace):
Conclusion
There remains significant unpredictability about the duration of the current economic downturn at this point, especially given the uncertainty around the pace with which governments around the world can get the spread of the pandemic under control. There have been encouraging efforts by both governments and central banks to provide enough stimulus to ensure that, should the pandemic be under control in weeks rather than months (allowing for the removal of movement restrictions), then economies around the world have every chance of bouncing back as sharply as they’re falling. However, if the pandemic and movement restrictions
persist long enough that governments are unable to prevent meaningful bankruptcies, defaults and retrenchments, then we will likely have a few more quarters of an economic slowdown and a slightly slower recovery.
At this point, global markets have priced in about 70%–80% of a normal recession. So, in the event of a relatively quick V-shaped recovery, it seems likely that markets will recover a fair portion of their losses fairly quickly. Should this pandemic drag on longer than hoped, it’s unlikely that we’ll see a sharp recovery in asset prices
for a couple of quarters although, with 70%–80% of a normal recession priced in, there’s unlikely to be significantly more downside. For at least the next few weeks, while we await more clarity on the pace of the spread of the virus, it’s likely that we’ll see significant moves in asset prices on both the upside and on the downside. For now, the most appropriate course of action seems to be patience, but always bearing in mind that the next bull market is likely to last significantly longer than this current bear market, with compounding driving gains to multiples of the losses investors are experiencing in the short term.


