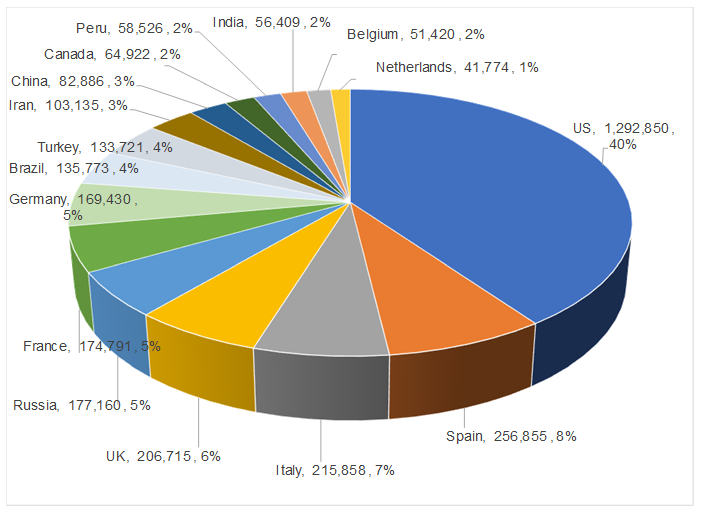
There is a huge amount of data around COVID-19 and below we highlight a few important points regarding the daily new cases of a few selected countries (the data are up to 7 May 2020). According to the Financial Times (FT), more than 3.73mn cases of COVID-19 have been confirmed globally and over 260,100 people are known to have died up to 7 May 2020.
Our observations are as follows:
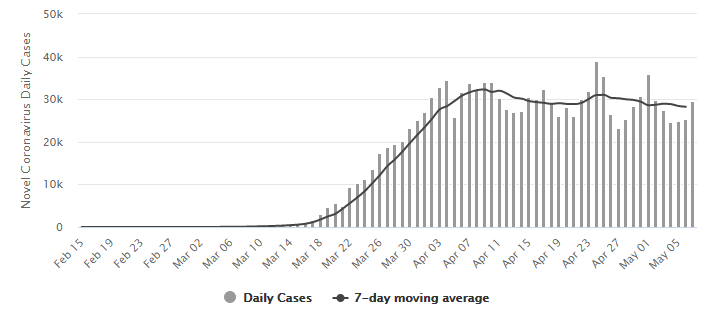
- In the US, now the epicentre of the disease, daily new cases are flattening, but at a high level of around 30,000/day – the highest in the world. The US has seen COVID-19 spread to all 50 states with more than 1.29mn cases and 76,942 deaths confirmed as at 7 May, according to Worldometer.
Figure 1: Daily new cases in the US
Source: Worldometer
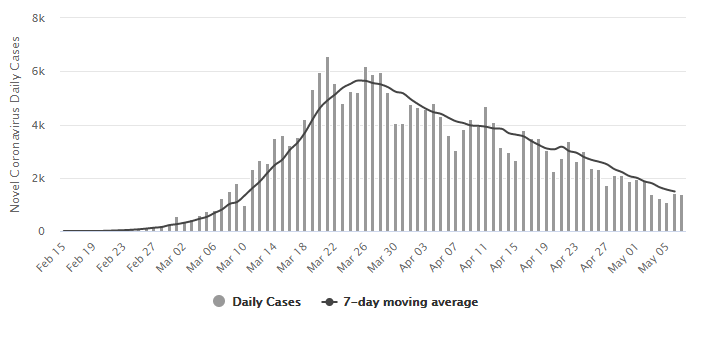
- However, the most mature example of Italy, the country hardest hit by the pandemic after China as the disease shifted to Europe, is showing an encouraging process in flattening the curve. After China and South Korea’s success, there is evidence in the developed world that this can be achieved.
Figure 2: Daily new cases in Italy
Source: Worldometer
- Unfortunately, there are still a few countries (besides the US), where the disease is running rampant. These include:
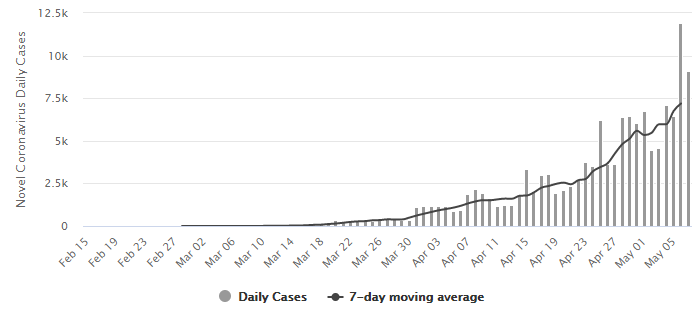
- Brazil with 5,000–10,000 new cases being reported daily (see Figure 3). The country now has a total of 135,773 confirmed cases, with 9,190 deaths.
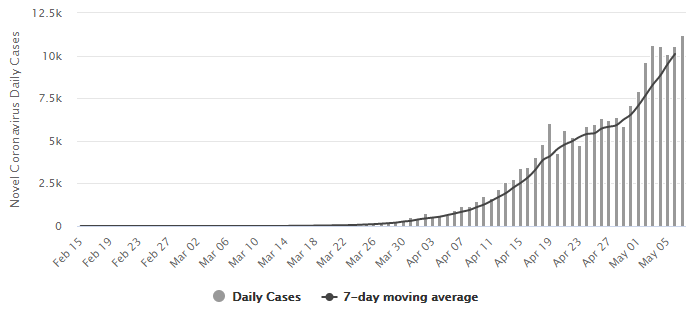
- Russia with over 10,000 new cases per day being reported (see Figure 4). Russia is currently standing at over 177,000 cases – the fifth-highest total in the world, overtaking Germany and France.
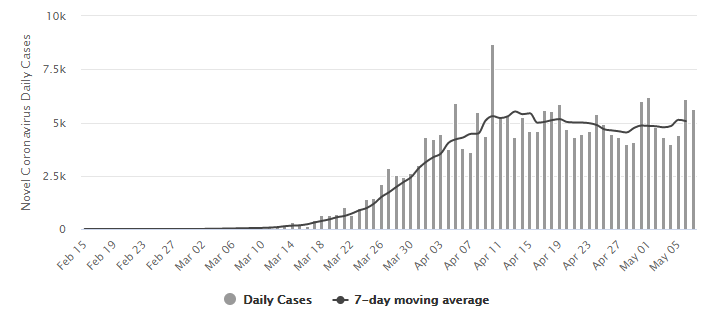
- The UK, with 5,000 new cases per day, remains a concern (Figure 5). The UK has recorded a total of 206,715 cases and 30,615 deaths.
Figure 3: Daily new cases in Brazil
Source: Worldometer
Figure 4: Daily new cases in Russia
Source: Worldometer
Figure 5: Daily new cases in the UK
Source: Worldometer
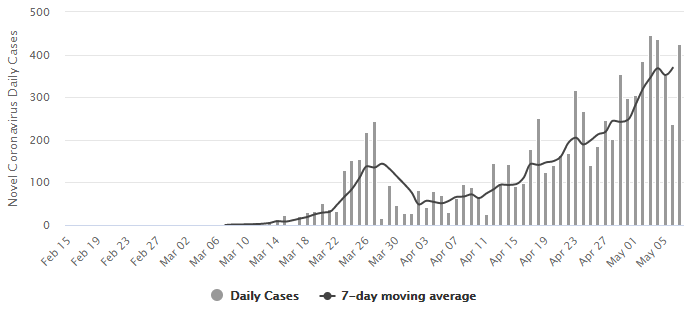
We highlight that South Africa (SA), with 300 to 400 new cases per day is close to a global standout (as at 7 May, see Figure 7). Why? Relative to our population size, deaths of 3 per 1mn people is close to the best in the world, and our daily testing continues to increase. Our new cases are in the hundreds, whereas comparative countries are in the thousands.
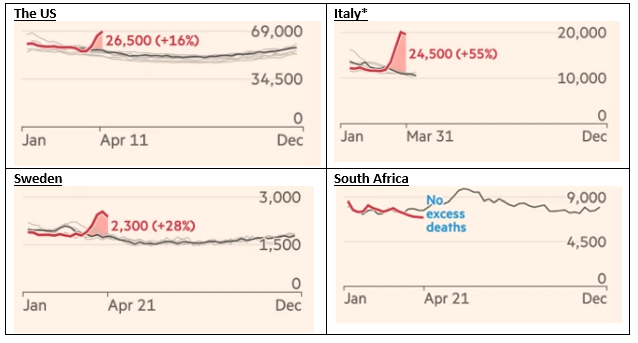
The FT recently analysed data on excess mortality rates globally (the number of deaths per week during this outbreak [in 2020] from all causes vs recent years in that country). Its analysis found that the death toll in SA, for example, shows no excess deaths vs historical data, while in countries most impacted by COVID-19, death tolls are 50%-plus higher than the same period in the past. According to the publication, in many countries, these excess deaths are significantly above the actual reported numbers of COVID-19 deaths (see Figure 6 below), meaning that the actual death toll from the novel coronavirus may be considerably higher than what is being reported in official counts.
The red line in Figure 6 below denotes deaths per week from all causes in 2020 (during COVID-19) vs historical averages over the same period (the grey lines). The shaded area with the data in red indicates the total number of excess deaths since the COVID-19 outbreak.
Figure 6: Excess deaths vs historical average following the COVID-19 outbreak
Source: Financial Times, data updated 6 May 2020.
*Italian data are a representative sample of 86% of the country.
Swift action by President Cyril Ramaphosa’s administration with the initial lockdown seems to have bought us time and it is unlikely that the country will be descending into the chaos experienced in the US and Italy, although this will depend on what happens over the next few weeks as the lockdown is eased. While this is encouraging, we have no idea what is still to come. The concerning aspect is that we should expect a material uptick in cases (if measured by world trends) and, off this low base, it might cause SA authorities to overreact in terms of restrictions. But the global trend of opening things up again should put pressure on the decision makers in government.
Figure 7: Daily new cases in SA
Source: Worldometer
Figure 8: Distribution of cases by country, as at 7 May 2020
Source: Worldometer

