The following table illustrates our house view on different asset classes. This view is based on our estimate of the risk and return properties of each asset class in question. As individual Anchor portfolios have specific strategies and distinct risk profiles, they may differ from the more generic house view illustrated here.

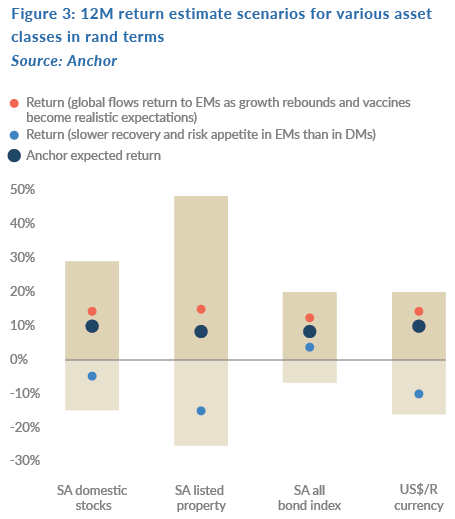
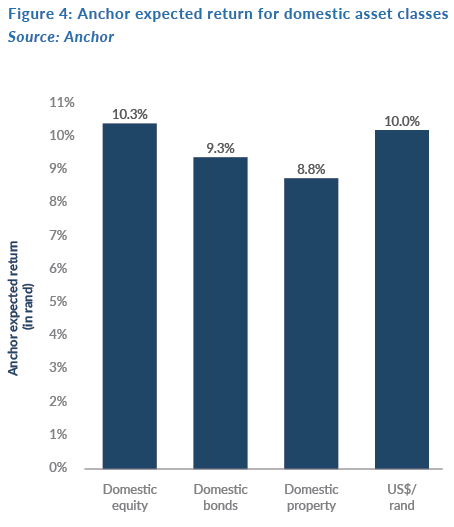
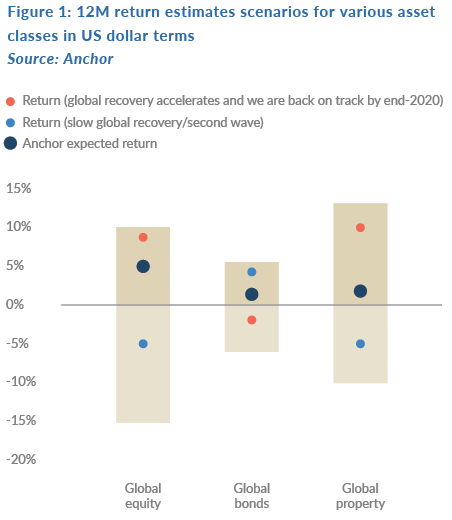
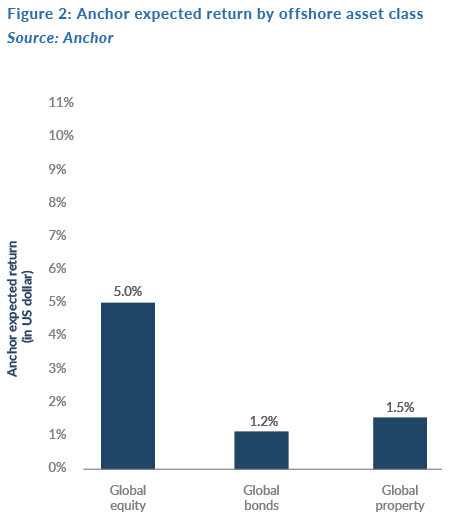
The range of possible outcomes for the various asset classes is particularly wide at present and it is also highly dependent on your outlook for the different scenarios. We have decided to display the possible outcomes as a series of tables and charts below. Anchor’s base case is somewhere between a scenario of recovering from the pandemic by year-end, or the global economy bumbling along for several years, while this plays out.
In Figure 1, we highlight the US dollar return outlook for the various global asset classes. The bars in Figure 1 represent the reasonable range of possible outcomes, with the dots representing our estimate of what the outcome will be in the different scenarios. From a global perspective, equity is the most attractive asset class if you do not expect the global economy to plunge into a second recession.
In SA, the range of possible outcomes is even wider given that much depends on both the extent of government’s structural reform and the behaviour of the global pandemic.
In Figure 3 below, we highlight the rand return outlook for several asset classes. The bars represent the reasonable range of possible outcomes, with the dots representing our estimate of what the outcome will be under the various scenarios. From a domestic investor perspective, bonds are the most attractive asset class on a risk-adjusted basis, but we should also not ignore local equity.
