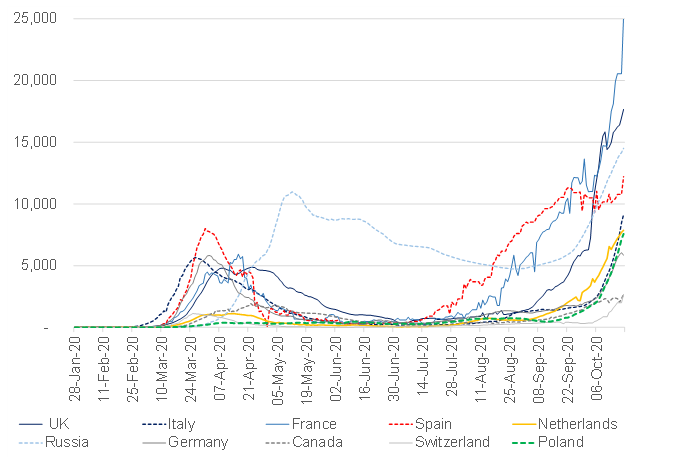
The end of the Northern Hemisphere summer has coincided with a spike in new COVID-19 infections in major Northern Hemisphere economies. This second wave of infections seems to be most destructive in Europe with several European countries (including France, Spain, Italy, Belgium etc.) taking urgent new measures this week to combat this second wave of infections. According to Johns Hopkins, the total number of worldwide cases of COVID-19 crossed the 40mn mark on Monday (19 October).
Figure 1: COVID-19: Major economies experiencing a second wave of infections
Source: Bloomberg, Anchor
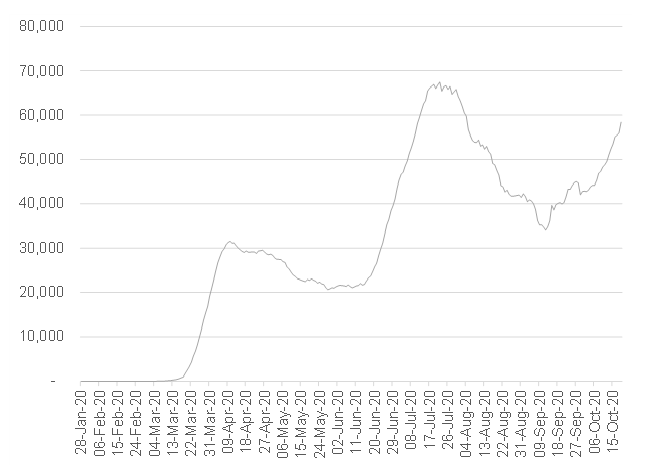
The world’s largest economy, the US, is also seeing a re-acceleration of new cases heading into winter.
Figure 2: US COVID-19 cases on the rise heading into winter
Source: Bloomberg, Anchor
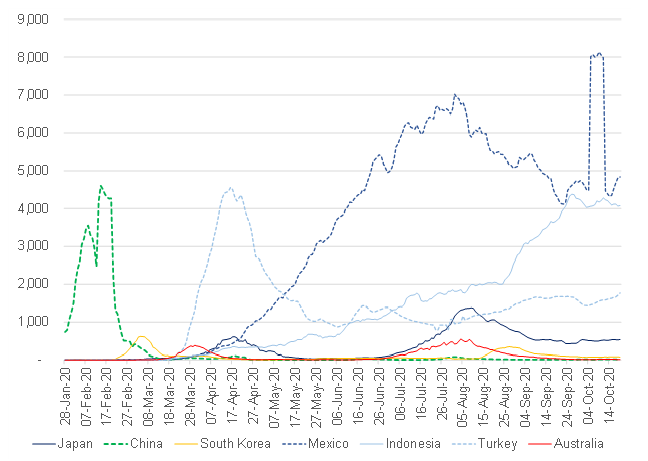
Meanwhile, in Asia, Japan, China, and South Korea have done a great job of avoiding any major second waves while some emerging market (EM) economies also seem to have stabilised new infections at fairly low levels.
Figure 3: Some Asian and EM countries have seen new infections stabilise at fairly low levels
Source: Bloomberg, Anchor
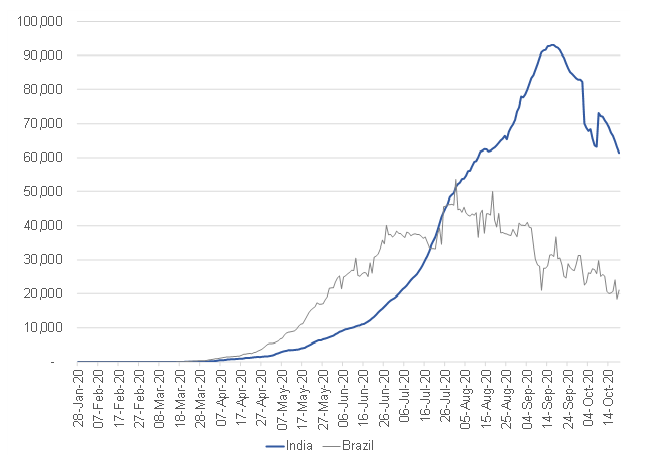
Elsewhere, Brazil, and India have managed to slow the spread of new infections.
Figure 4: Major EM economies getting the spread of infections under control
Source: Bloomberg, Anchor
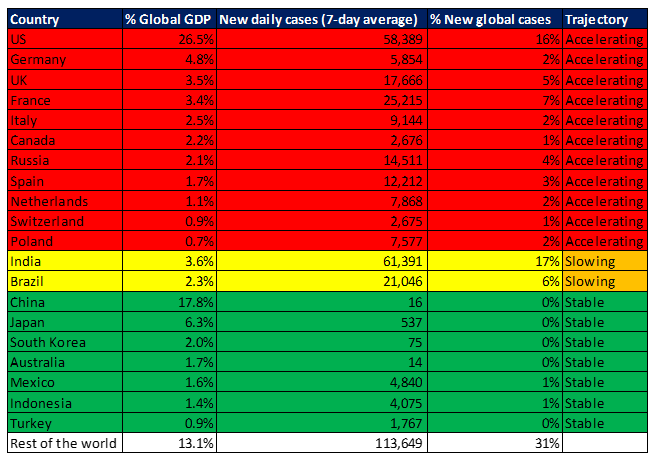
Our calculations suggest that the 18 countries representing more than 85% of total global economic activity can be broadly categorised as follows:
- 11 countries representing 50% of global economic activity are seeing new infections accelerate.
- 7 countries representing c. 30% of overall global economic activity have stabilised the rate of new infections around fairly low levels.
- Brazil and India (together representing c. 6% of total global economic activity) appear to be slowing the pace of new infections.
Figure 5: Trajectory for new infections in the largest global economies
Source: Anchor, Bloomberg
Encouragingly, despite accelerating infections in those countries representing half of the world’s economic activity, many countries appear to have become more effective at introducing mobility restrictions with a much lower impact on economic activity. UBS has developed a scoring system on a scale of 1–10 to indicate the level of restrictions by various countries (0=no restrictions, 10=maximum restrictions). This indicator, when aggregated based on GDP, reached a level of around 6.5 in March/April at the height of the first wave of the COVID-19 pandemic, when new daily infections stood at c. 80,000. New daily infections are now in excess of 350,000 and yet aggregate mobility restrictions are only marginally above 3.
UBS estimates that each 1 point increase in mobility restrictions (when applied for at least one quarter) results in a c. 6% decrease in GDP, so while any increase in mobility restrictions is a net negative for economic activity, it seems that despite 13 of the 43 countries mapped by UBS increasing mobility restrictions in the last week, the incremental impact on global GDP should be negligible. This is partially as a result of the world’s biggest economies (China, the US, and Japan, which together represent half of total global economic activity) not increasing mobility restrictions, but also hopefully because those economies that are increasing restrictions are being more considered in their approach.


