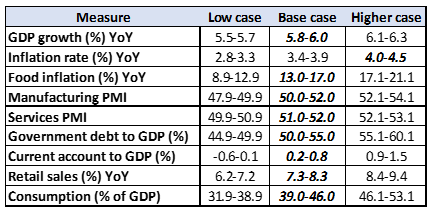
South Africa
Figure 1: SA economic data summary
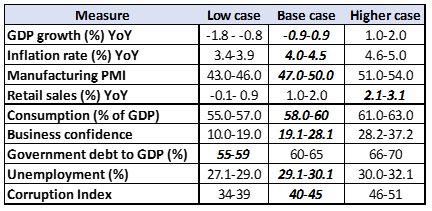
Note bold and italics denotes latest data point.
Source: Anchor, Trading Economics.
Anchor outlook: SA growth is slowing as reforms lag
The South African (SA) economy had a gloomy 2019, amongst declining growth and lagging reforms. Despite a more positive 2Q19 GDP growth data print (surprising on the upside at 3.1% YoY), 3Q19 once again recorded a decline in growth of 0.6% YoY. The SA economy is currently stuck in its longest downward cycle since 1945, having not expanded by more than 2% p.a. since 2013. Whilst SA’s fiscal position has experienced a downward trend for the past 10 years, concerns are now mounting around the rapid decrease over the past two years specifically. Government debt printed at 55.8% of GDP in 2018 and is forecast to rise to 60.8% in 2019/2020 and 73.7% in 2023/2024.
The slowdown in economic growth and revenue receipts, wasteful public-sector spending, administrative and efficiency challenges at the SA Revenue Service (SARS) and a high public sector wage bill are the greatest contributors to rising debt levels in SA. Due to a decade of corruption and mismanagement, State Owned Enterprises (SOEs) remain a key challenge for government, with SOEs’ financial troubles dominating the headlines throughout 2019. SAA was placed under voluntary business rescue, while Eskom instituted unprecedented stage-6 level load shedding in December. As we will likely see in the 4Q19 GDP data print, this will prove to have been extremely damaging for job creation and economic growth. Conversely, the SA RMB/BER Business Confidence Index rose for the first time in two years to 26 in 4Q19, after reaching a 20-year low of 21 in 3Q19, as sentiment rose among constructors, manufacturers and retailers. However, sentiment remains low with the index well below the 3-year high of 44 reached in 1Q18, when President Cyril Ramaphosa ascended to power.
2020 has started off on a sour note, following the resumption of load shedding and the World Bank revising its 2020 GDP growth forecast for SA to 0.9% from 1%. The forecast is lower than the growth projected by the National Treasury (1.2%), the SA Reserve Bank (1.2%) and credit rating agencies Moody’s, Standard & Poor’s and Fitch Ratings, which all expect the economy to expand by 1%. The World Bank forecasts GDP growth averaging 1.4% in 2021-2022 if Ramaphosa’s administration implements the necessary structural reforms and addresses the current swathe of policy uncertainty, subsequently leading to a recovery in public and private sector investment. However, given the continued absence of any meaningful structural reforms to lift consumer and business confidence and thus the pace of investment in the private sector, economic growth is likely to continue to disappoint over the medium term – thus further complicating the challenge of stabilising public finances and SA’s rising debt levels. Business and consumer confidence remain lacklustre, and electricity (in)security has quickly become the single biggest risk to a rebound in economic growth. The February 2020 Budget Review by the minister of finance remains a key focus event for 1Q20 – the announcement of concrete measures surrounding the reduction of the compensation bill, reviving economic growth and the stabilisation and restricting of Eskom remain crucial. Strong political will and social coherence between government, business and labour is needed in order to place SA firmly on the path to recovery.
SA economic data overview:
The SA economy contracted by 0.6% YoY for 3Q19, coming in far weaker than market expectations of a 0.1% expansion. Mining, manufacturing, transport, storage and communication industries were the highest contributors to the contraction. The annual inflation rate rose to 4% in December 2019 from 3.6% in the previous month, matching market expectations. The Manufacturing purchasing managers index (PMI) declined to 47.1 in December 2019, down further from 47.7 in the previous month (above 50 signals expansion, while below 50 is contraction). The December reading indicates the fifth-consecutive month of contraction in factory activity, amongst declines in new orders and business activity due to Eskom’s implementation of the most severe power cuts to date in December. Electricity production decreased to 20,653 Gigawatt-hour in November from 21,571 Gigawatt-hour in October 2019. Conversely, the RMB/BER Business Confidence Index rose for the first time in two years to 26 in 4Q19, after reaching a 20-year low of 21 in 3Q19, as sentiment rose among contractors, manufacturers and retailers. However, sentiment remains low with the index well below the 3-year high of 44 reached in 1Q18, when Ramaphosa became president. SA’s private consumption expenditure accounts for 58.8 % of nominal GDP as of September 2019, with retail sales increasing 2.6% YoY in November 2019. The unemployment rate currently sits at 29.1% (for 3Q19), with a government debt equivalent to 55.8% of the country’s GDP in 2018. SA also currently scores 44 points out of 100 on Transparency International’s 2019 Corruption Perceptions Index.
The US
Figure 2: US economic data summary
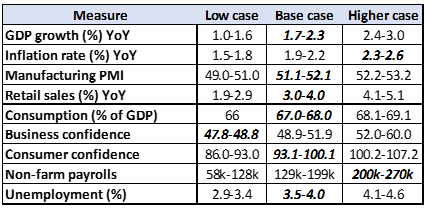
Note bold and italics denotes latest data point.
Source: Anchor, Trading Economics.
Anchor outlook: Uncertainty reigns
If the US economy closely resembled any object, it would be a broken traffic light – the overall financial and economic system is flashing every colour possible, from healthy greens to yellow warning lights to heavy recession-red colours. With so many mixed signals … uncertainty reigns! Currently, economic growth remains on a solid footing, but once you dig below the surface, things start to look a little more fragile. The US economy grew by an annualised 2.3% in 4Q19. Private inventories were revised higher and business investment shrank less than anticipated. The job market has provided a comforting steadiness to the US economy amid global uncertainty, whilst employers have added positions for a record 109-straight months, but the pace of job creation is slowing – this time last year, the US economy had added nearly 2.26mn new positions. However, with the US expansion now in its eleventh calendar year — the longest on record —some slowing is to be expected. Consumers continue to prop up the economy, since two-thirds of the US economy is based off consumer spending, growth relies heavily on how willing consumers are to spend. Net exports and private fixed investments and inventories weighed on growth, but the US consumer kept it on solid footing. Consumption grew by 2.9%, contributing more to growth than any other category – thus consumers remain the bright spot in the US economy.
However, manufacturing remains a key concern amid the slowdown caused by the trade wars. It’s a tale of two economies – the American consumer continues to prop the economy up, but other aspects such as investment and manufacturing, are weakening. Whilst the trade war with China appears to have settled for now – the business community remains spooked. The US’s current expansion is largely built on a potentially shaky combination of high deficits and low interest rates — once the expansion ends (as it will eventually) it could do so painfully. Significant downside risks remain – including the potential escalation of trade fights, sharp slowdowns in Europe and other leading nations, financial disruptions in emerging markets (EMs) like China and India. Less than a week and a half into 2020, the US was awash with fresh uncertainty surrounding the events concerning Iran. However, fears of all-out war have settled after President Donald Trump responded with a more measured response to the Iranian missile strikes.
Leading further into 2020, the upcoming US presidential elections continue to fuel uncertainty within the US. Political analysts across the globe are attempting to calculate the extent to which Trump’s impeachment trial will either work for or against him. On 5 February, Trump was acquitted but how exactly this will play out in voters’ minds remains to be seen. With leading Democratic candidates offering vastly different policy platforms, it is difficult to imagine how the US economic landscape will look at the end of 2020.
US economic data overview
The US economy grew by 2.3% YoY in 4Q19, following a 2.1% expansion in the previous three-month period. The increase reflected positive contributions from federal government spending, residential investment, exports, and state and local government spending. The inflation rate increased to 2.3% YoY in December 2019, from 2.1% in the previous month and in line with market consensus. It forms the highest rate since October 2018, boosted by a sharp rebound in energy costs. The IHS Markit US Manufacturing PMI printed at 52.4 in December 2019, compared to 52.6 in the previous month. Global trade remains the most significant cross-industry issue, however there are signs that several industry sectors will improve as a result of the phase-one trade agreement between the US and China. Retail sales increased to 3.30% in November 2019, whilst the US’s private consumption accounted for 67.9 % of its nominal GDP in September 2019.The University of Michigan’s consumer sentiment for the US printed at 99.3 in December 2019 – the highest reading since May 2019 and the second-best for the year, off the back of perceived improved market current conditions and more positive inflation expectations. Non-farm payrolls increased by 145,000 in December 2019, lower than market expectations of 164,000. The US unemployment rate was unchanged at 3.5% for December. The US Federal Reserve (Fed) left the interest rate target range unchanged at 1.5%-1.75% on 29 January 2020 matching market expectations.
The UK
Figure 3: UK economic data summary
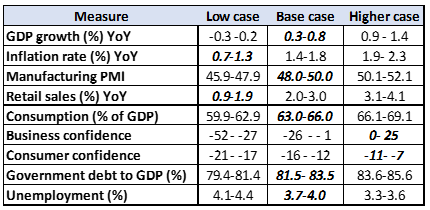
Note bold and italics denotes latest data point.
Source: Anchor, Trading Economics.
Anchor outlook: Brexit uncertainty still the predominant issue entering 2020
December 2019 finally brought some much-needed clarity to the UK’s plans for exiting the EU, as UK voters delivered a strong mandate to Prime Minister Boris Johnson to proceed with his proposal to exit the EU by end-January 2020. Johnson’s conservative government’s representation in parliament increased from 46% to 56% as a result of the December election, consequently providing them with the majority required to execute Brexit. This new Brexit clarity rallied the pound – seeing it rise over 10% against the US dollar since its August lows when the UK faced the very real possibility of leaving the EU without a deal. As of end-January, the UK has now formally left the EU, ending its 47-year membership of the world’s biggest trading block. Whilst there is now more clarity around Brexit than six months ago, many doubts and questions remain. Some of the uncertainty surrounding prominent issues like the residential status of UK and EU residents living within the respective countries has been cleared. However, the most prominent Brexit issues, such as future trade relations, the Northern Ireland protocol, data protection and fishing rights, have yet to be ironed out.
The key trade concern is not whether a tariff- and quota-free deal can be reached, but moreover the degree to which the UK can diverge from EU rules and standards without the need for arduous and time-consuming checks at the EU-UK border. There appears to be acceptance now on both sides that there may need to be a series of sectoral mini deals. A single overarching deal is unlikely to be achieved by the end of 2020. Projections at this point remain difficult – much depends on the outcome of the next series of negotiations between the UK and the EU.
UK economic data overview
UK GDP annual growth slowed to nine-and-a-half year low – GDP expanded 1.1% in 3Q19, slowing from 1.3% in 2Q19 and missing market consensus expectations of 1.1%. That was the weakest growth rate since 1Q10. The inflation rate printed at 1.3% YoY in December 2019, its lowest reading since November 2016 and below market consensus forecasts of a 1.5% print. The IHS Markit/CIPS UK Manufacturing PMI printed at 47.5 in December 2019, well below the previous month’s 48.9. Production declined by the most since July 2012, and incoming new work decreased for the eight-consecutive month, primarily due to continued concerns surrounding global economic, trade and political outlooks. The UK unemployment rate stood at 3.8% in the three months to end-November 2019 – its lowest level since early 1975 and in line with market expectations. Meanwhile, the CBI’s quarterly gauge of manufacturing optimism in the UK rose by 23% in 1Q20, its highest level since 2Q14. The GfK UK consumer confidence rose 2 points to -9 in January 2020, climbing for the second-consecutive month after reaching its lowest level since 2013 in October and November ahead of the December UK election. It was also its highest print since September 2018. Retail sales registered a 1.7% YoY rise in December, less than market expectations of a 2.0% YoY increase.
The eurozone
Figure 4: Eurozone economic data summary
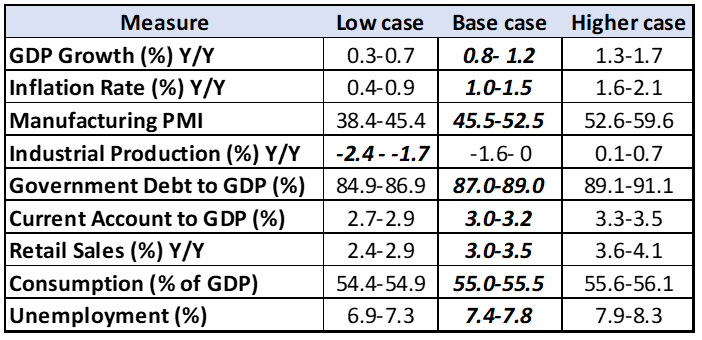
Note bold and italics denotes latest data point.
Source: Anchor, Trading Economics.
Anchor outlook: Much of the same – slowdown and slowly running out of options
The economic situation in the eurozone has remained on the same path since the start of 2019 – the export-oriented continent still suffers from uncertainties related to global trade conflicts and the resulting unwillingness of corporates to invest. Consequently, growth has been slowing, although it remains positive. Among the bloc’s largest economies, Germany avoided entering a recession in 3Q19, largely driven by public and private consumption, while GDP growth rates were unchanged in France, Italy and Spain. Private consumption is a crucial factor that can counter a slowdown which could eventually lead to a recession. Driven by still-strong labour markets, private consumption remains a key growth engine of the eurozone economy.
Owing to headwinds from international trade and the ongoing uncertainty surrounding Brexit, the eurozone’s manufacturing sector has been in a recession for the whole of 2019 and is now in its twelfth-consecutive monthly contraction. Germany has been particularly impacted by the industrial recession, given its strong focus on manufacturing. However, Germany is hardly alone – among the other big eurozone economies, Italy also has a strong manufacturing base. Conversely, countries that are less reliant on exports and manufacturing are doing better. Looking at quarterly growth rates, Spain is still the best-performing among the major eurozone economies (a 0.4% YoY rise in 3Q19), followed by France (+0.3% YoY), while the Italian and German economies are stagnating.
There are specific reasons as to why the European economy has suffered far more than its global counterparts in 2019 off the back of the US-China trade conflict – Europe is extremely vulnerable to collateral damage from a trade war as it is more dependent on trade. Exports account for 28% of the eurozone’s GDP, compared to only 12% for the US and 19% for China. The problem in the eurozone—as the former European Central Bank (ECB) President Mario Draghi continues to point out—is that monetary policy is reaching the limits of what it can do. Interest rates are already negative on trillions of dollars of bonds. Despite consecutive rate cuts, the ECB policymakers are deeply (and very publicly) divided on the effectiveness of these steps. Looking further into 2020, the eurozone’s ongoing trade spat with the US remains a significant concern, with the dispute ranging from issues surrounding US tariffs on European steel, European goods due to the Airbus-Boeing dispute (with a further set of European retaliatory tariffs potentially in the pipeline), and US tariffs on French goods in response to a controversial French digital tax.
Eurozone economic data overview
Eurozone economic growth printed at 1.0% YoY for 4Q19, missing market expectations of a 1.1% YoY increase. Inflation printed at 1.3% YoY for December. The IHS Markit Eurozone Manufacturing PMI came in at 46.3 in December, pointing to the eleventh-straight month of contraction in factory output, amid declining orders and further job shedding. Industrial production declined by 2.2% YoY, indicating its twelfth-consecutive month of contraction, led by declines in capital and intermediate goods output. Retail sales increased by 2.20% YoY in November, with private consumption expenditure accounting for 55.5% of September’s nominal GDP. For 2018, the eurozone recorded a government debt equivalent to 87.90% of the country’s GDP and a current account surplus of 3.10% of GDP. The unemployment rate stood at 7.4% in December 2019, its lowest level since May 2008, but still below market expectations of 7.5%. The total number of unemployed decreased by 34,000 from the previous month to 12,251. Among the bloc’s largest economies, the lowest unemployment rate was recorded in Germany (3.2%), while higher rates were observed in France (8.4%), Italy (9.8%) and Spain (13.7%).
China
Figure 5: China economic data summary
Note bold and italics denotes latest data point.
Source: Anchor, Trading Economics.
Anchor outlook: Slowdown and uncertainty … but steady survival into 2020
After an eventful 2019, China is heading into 2020 amid a great deal of uncertainty. Phase one of the US-China trade deal has been signed – de-escalating the nearly two-year long trade war between the world’s two biggest economies. Through the deal China has committed to purchasing an additional US$200bn in goods and services from the US by the end of 2021. Whilst the signing of the deal is an important step forward for the global economy, many remain sceptical of China’s ability to absorb such a large amount of US energy and agricultural products in such a tight time horizon. Therefore, it is inevitable that trade diversion will have to occur – i.e. several of China’s trading partners will lose out. In return, China hasn’t gained much from the deal – apart from the US pledging to reduce its 15% tariffs on US$120bn worth of Chinese goods to 7.5% and to suspend plans for other tariffs. Many of the trickier issues of the trade spat have yet to be addressed. What China does gain from the deal is time – thus temporarily stabilising the relationship, pre-empting any further actions again Chinese companies, and overall removing some of the pressure on the Chinese economy.
Equally, protests in Hong Kong may have calmed but the underlying, long-term socioeconomic issues have yet to be resolved. Amid China’s current slowdown in growth, the government is powering ahead with its campaign to contain financial risks, raising further concern about the country’s ability to maintain its decades-long streak of rapid economic growth. Despite China’s downward trend, the country still accounts for 39% of global growth. Going into 1Q20, recent macroeconomic data imply that China’s recent loss in economic momentum has evened out. Since October, the data is much improved and better than initially envisioned. Growth in industrial production has rebounded, fixed-asset investment has stabilised (lifted by public sector projects), domestic consumption has increased, and real estate has remained resilient despite Chinese authorities remaining tight on financing. Overall, the Chinese economy expanded by 6% YoY in 4Q19, and has good momentum leading into 1Q20. However, projections remain tight on economic growth dropping below 6% for 2020.
The rapid spread of the new coronavirus has become the primary concern going further into 1Q20. It appears that the current outbreak will have a materially larger footprint than Severe Acute Respiratory Syndrome (SARS), with the total number infected already twice as large as seen back in 2003. As at 6 February 2020, there are 24,631 cases and 494 fatalities confirmed in China. As the outbreak continues to spread, the likelihood of a material economic impact increases. Off the back of the SARS virus in 2003, Chinese GDP growth slowed dramatically, from 11% to 9% YoY before rebounding strongly. A similar scale hit would see economic activity contract in 1Q20, with YoY growth possibly decreasing to around 4%. The rapid spread of the virus, along with the fact that many Chinese citizens are choosing to stay home, suggests that once again it will be a short, sharp shock to the Chinese economy. However, the true economic impact of the new coronavirus remains difficult to project, with so little understood of the virus itself. A material slowdown in the economy would likely be met with increased stimulus from the Peoples Bank of China (PBoC), which would correspondingly boost the 2Q20/3Q20 recovery. However, in the near term, the government’s focus remains on containment of the virus itself.
China economic data overview
The Chinese economy advanced by 6.0% YoY in 4Q19 – the same as in the previous quarter and matching market expectations. The annual inflation rate steadied at 4.5% in December 2019, less than market expectations of a 4.7% print. Nevertheless, it remains the highest inflation rate since January 2012, as pork prices surged 97% YoY due to a prolonged African swine fever epidemic. Consequently, food inflation rose 17.4% YoY in December, with pork prices rising for the tenth month in a row. The Caixin China General Manufacturing PMI fell to 51.5 in December from 51.8 in the previous month. New orders growth slowed to three-month lows, amongst a marginal rise in exports, while output expansion remained strong overall. The Caixin China General Services PMI fell to 52.5 in December from a seven-month high of 53.5 in November. China recorded a government debt equivalent to 50.50% of GDP and a current account surplus of 0.40% in 2018. China’s retail sales printed at 8% YoY in December 2019, unchanged from the previous month’s five-month high and above market expectations of a 7.8% YoY increase. China’s private consumption accounted for 39.4 % of its nominal GDP in December 2018.