Summary
September was dominated by US yields rising from a low of 1.44% to c. 1.82%. This nearly 40-bpt rise in bond yields has had knock-on effects that have been felt across the globe. The reduced impetus for the carry trade has, in part, been to blame for domestic bonds weakening. We continue to hold that there is a risk aversion premium in current bond yields and that a fair yield is closer to 2%. In a scenario where everything goes right, we could see bonds sell off further. In the September Anchor Fixed Income monthly, we look at what has been driving yields, initially towards lows for the year, and what sparked the US sell-off in September.
Introduction
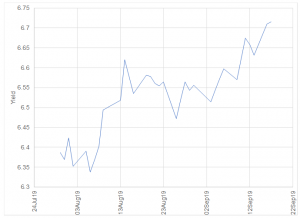
US Treasury securities have moved dramatically in price over September. On 3 September 2019, the 10-year Treasury reached a 3-year low of 1.441%. As seen in Figure 1 below, the past month has also seen a dramatic weakening in the yield – from the low mentioned above to current trading levels of 1.829%.
Over the period, as per Figure 1, a high of 3.232% was reached on 8 November 2018, and the average has been 2.298%. An all-time low (of 1.366%) was recorded in June 2016. We note that this is only 5 bps below the 3 September 2019 low, reflecting the volatile nature of the US 10-year yield over the past 3 years.
In September’s Anchor Fixed Income monthly, we attempt to understand the drivers of: (1) the US 10-year rally to 3-year lows; (2) the subsequent weakening to current levels of ~1.8%; and (3) we plot a vision of how the US 10-year might evolve and the risks that will delineate that path.
Figure 1: US 10-year treasury yield
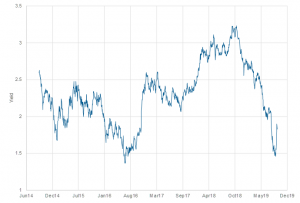
Source: Thomson Reuters
Why did US yields drop so low?
Below, we highlight the reasons why we believe US yields dropped to such low levels. These include:
- A flight to safety: Investors feared a global recession, particularly as the US yield curve inverted (the 10-year to 2-year spread became negative). The inversion itself, seen as the precursor to an impending recession, drove buying pressure and forced yields lower.
- Global instability: Investors are faced with global political instability. From coalition governments propped up by support from populist parties (for example in Italy, where that country’s anti-establishment, Five Star Movement [M5S] and Lega Nord [or Northern League] hold substantial sway) to US President Donald Trump’s brand of politics by tweet and the continued uncertainty around Brexit, investors have grown weary of risk.
- Fears of deepening trade wars: Continued tariffs applied by the Trump administration to Chinese goods, have dimmed investor confidence and driven fears of an impending recession.
- Other developed market (DM) bonds delivering negative yields: As investors see bonds in other DMs delivering negative yields for sustained periods (Germany’s 10-year bund, for example, has been negative since March 2019) there is a flight to yield, increasing demand for US treasuries.
Figure 2: German government bonds 10-year DBR
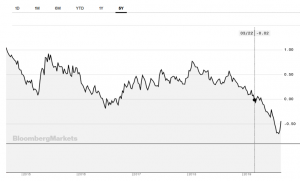
Source: Bloomberg Markets
Unpacking the yield drop
- Market reaction to bad news: Given the predisposition of market actors to negative news and with all signs pointing towards a recession it resulted in a near-instant flight to safety, with the US 10year to 2-year spread tightened (a traditional sign of an impending recession is the inversion of these rates, 10yr<2yr), and buying pressure on the 10-year pushing the spread negative in late-August 2019.
- Trade war probabilities: Through 2Q19 and 3Q19, continued tariff applications that have marked the “trade war” have deepened both in terms of the scope of goods to which tariffs are applied as well as to the size of these tariffs (for example, US tariffs on Chinese imports increased from 10% to 15% on 1 September). In addition, deepening fears of an escalation in the trade war through to late-August drove investors to safe-haven assets, such as the US 10-year.
Figure 3: US 10-year to 2-year spread
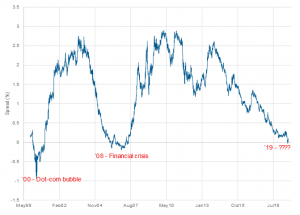
Source: Thomson Reuters
Why did US yields increase?
- Overreaction: Investors overestimated how bad things had become. Relative to the recent past (2019), the Volatility Index (VIX) has traded around its average of 14.78% since January 2016. Investopedia defines the VIX as an index representing the market’s expectation of 30-day forward-looking volatility. The data are derived from the price inputs of the S&P 500 Index options and the VIX provides a measure of market risk and investor sentiment.
- Lower trade wars fears: Since the beginning of September, when yields reached multi-year lows, the start of a thaw in trade war pressures began. Trump agreed, in principle, to a deal with Japan, sparking hope that a similar deal could be struck and passed with China.
- EM bonds became more attractive: As US yields reached multi-year lows, safer EM bonds became attractive investments delivering better yield pickup, with India’s 10-year bond offering 6.7%, while still providing investment grading, inflation of ~3.1% and a 10-year credit default swaps (CDS) cost of ~80 bps.
Figure 4: The VIX volatility index
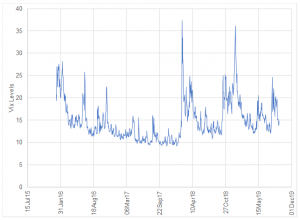
Source: Thomson Reuters
Figure 5: India 10-year bond yield
Source: Thomson Reuters
Unpacking the September 2019 yield increase
- Overreaction: Investor over-eagerness to move to perceived safe assets resulted in the yield over-tightening.
- Consumer strength: The US consumer remains strong, the Consumer Confidence Index (as well as its sub-index – the expectations index) remain at elevated levels. Since September 2008, US consumer confidence has consistently increased, and expectations remain stable at levels above the long-term (since 1978) average of 90.6.
- Selling pressure: As those who bought in at cheaper prices (when yields were elevated) saw willing buyers at elevated prices, the balance of supply-demand shifted against US treasuries and towards EM bonds (see Figure 7).
- A softening in trade wars: On 11 September 2019, China exempted 16 US products from tariffs for one year. Simultaneously, Trump announced a delay to certain tariff applications which were expected to start on 1 to 15 October 2019. This was the first sign that there may be progress made on resolving the ongoing crisis.
Figure 6: US consumer confidence indices
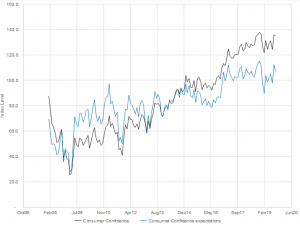
Source: Thomson Reuters
US 10-year strength and EM 10-year weakness
At the same time, as the dollar strengthened, EM counters weakened, making them more attractive buys on a relative basis. In Figure 7, we graph a comparison between the BR-US 10-year spread and the US 10-year (separate axes). This is reflected in the spread expanding as the dollar strengthened. The two lines inflect in early September, exactly as the US 10-year bottomed out and the spread recorded maximum expansion. Subsequently, the US 10-year has sold off, and the spread has contracted. We note that this spread is still well below levels reached earlier this year (a high of 7% was recorded in March 2019).
Figure 7: BR vs US 10-year yield evolution: July 2019 to present
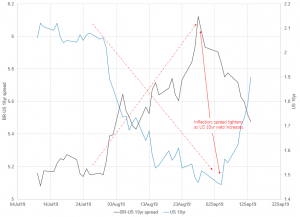
Source: Thomson Reuters
Fair yield on the US 10-year
- Linear regression approach: One approach to estimating a fair yield on the 10-year US Treasury is to regress its historical behaviour against a number of other variables (we used US GDP and CPI). This then gives a formulaic expression – if one can forecast the underlying variables, one can forecast the US 10-year yield. This is sensitive to the regression period (we regress for three windows). Here we see that the realised yield has trended downward to its current level (to the last CPI and GDP print for March 2019), where it sits below every regressed yield.
- Anchor fair-value approach: Anchor fair value is determined by the combination of a quantitative and fundamental approach, taking into account Fed fund futures, current (and expected) CPI, as well as applying a term premium and a real-return expectation. Currently, this values the US 10-year to be fair at a 2.2% level.
Figure 8: US 10-year vs various regressions
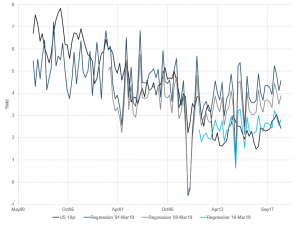
Source: Thomson Reuters
Looking to the future, upsides and risks
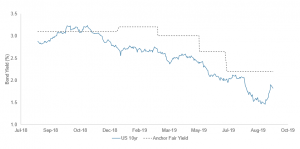
- Downsides: Current valuations place the US 10-year in the expensive category on both methodologies. This follows the recent increase in yield from ~1.4% to ~1.8%. As seen in Figure 9 below, we note that the US 10-year has consistently priced tighter than our valuation (since late 2018), indicating a strong risk-off market that has persisted. Thus, the current yield prices in considerable political risks (in the recent past perhaps as much as 80 bps worth). The downside risks are tied to political risks decreasing in severity over the short term. Were this to occur, it is likely that pricing will return to the fair range of ~ 2.1%
- Upsides: Given that the current valuation is already so strongly risk-off, the probability of substantial further tightening seems remote – early-September 2019 tested all-time lows. However, the political risks mentioned above are substantial, and were some or all of these risks to be realised in an extreme fashion, the sub-1.4% low could be tested in the short term.
Figure 9: US 10-year vs Anchor fair value
Source: Thomson Reuters
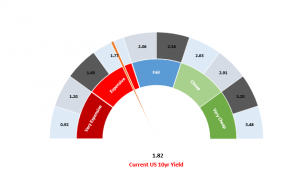
Figure 10: Anchor US bond yield monitoring
Source: Thomson Reuters