Executive summary
- The US yield curve has recently ‘inverted’ (i.e. short-term US government bond yields are now higher than long-term US government bond yields).
- An inverted yield curve is the most reliable leading indicator for US recessions, having occurred before all seven US recessions over the course of the past 50 years.
- Only once, over the past 50 years, did the inverted yield curve produce a false signal, in 1998 during the emerging markets (EMs) currency crisis, where the US Federal Reserve (Fed) was able to intervene and stave off a recession.
- For the past three US recessions, the inversion happened about 1–2 years before the recession.
- In two of the past three US recessions, between the start of the yield curve inversion and the recession, the S&P 500 Index delivered a strong positive return (26.2% and 18.6%). The exception was the 2001 recession, when the yield curve inversion occurred during the tech bubble when the S&P 500 was priced at 29.7 times trailing 12-month earnings.
Conclusion
After almost 10 years of US economic growth, it’s highly likely that we’ll see a US recession in the next few years. There’s a strong possibility that this yield curve inversion could be the leading indicator that the US economy will move into recession in the next 1–2 years, although there are strong parallels to the ‘false’ inversion in 1998, when the Fed was able to step in and normalise the yield curve, thus delaying the start of the next recession by almost 3 years. Given that equity market valuations don’t seem to be in bubble territory, there is a strong possibility that equity investors could still see decent double-digit returns over the next 1–3 years. So, rather than rushing to put cash under the mattress, this is probably a more timely reminder to reassess asset allocation and ensure that investable assets that are needed to fund lifestyle commitments over the next 1–3 years are not invested in equities, but for assets where you have a longer time horizon, this is probably not the time to panic.
The market’s most reliable leading indicator, the inverted yield curve, is telling us to prepare for a US recession. Inversion essentially means that the yield on short-term (6 months to 2 years) US government notes/ bills is higher than the yield on long-term (10-year) US government notes. The yield curve has inverted before each of the past seven US recessions over the course of the past 50 years.
Figure 1: All US recessions were preceded by inverted yield curves over the past 50 years
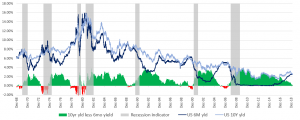
Source: Bloomberg, Anchor
The more important question to ask is not if we’ll see a US recession, but how long before it starts and what happens to asset prices between now and then. Over the past 30 years, post the high inflation period of the 1980s, we’ve had 4 cases of inverting yield curves and 3 recessions.
Figure 2: Historical timing of inversions and recessions
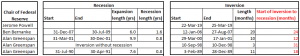
Source: Bloomberg, Anchor
The exception to the rule regarding inverting yield curves came in 1998 when the yield curve inverted for about 3 months as markets worried that the EM crisis would be enough to knock over the US economy. The Fed responded timeously with 3 rate cuts, allowing the yield curve to normalise for about 15 months before inverting again in 2000 in the lead-up to the 2001 recession. There are many parallels to this 1998 ‘false’ inversion signal in the current environment with geopolitical risks, particularly around trade wars, concerning the market but also with the Fed responding with caution. It’s not inconceivable that the Fed will cut rates in 2019 in an attempt to stabilise the market. Interest-rate derivatives are currently predicting an almost 80% chance of a rate cut by the Fed in 2019.
So, there seems a reasonable probability that we’ll see a US recession in the next 1–3 years and if that’s the case, how do we expect to see the various asset classes perform over that period? Using history as our guide suggests that equity markets have a reasonable chance of delivering strong double-digit returns between now and the next recessions.
Figure 3: Asset class returns and economic conditions in the lead-up to recessions
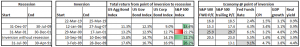
Source: Bloomberg, Anchor
In the period between yield curve inversions and recessions we’ve only seen one example in the past 30 years where you’ve had a negative outcome in equity markets – in the lead-up to the 2001 recession, which also coincided with the bursting of the tech bubble, when internet companies were trading at ridiculous valuations. Certainly, from a valuation perspective, it seems unlikely that we’ll see a similar outcome at current market valuations.