The US economy is entering a phase of disinflationary growth, a theme we identified last year. Economic activity remains robust and is increasingly underpinned by productivity gains, while the balance of risks points to a gradual rise in the unemployment rate and easing inflation. This dynamic is becoming more evident in the data. US real GDP expanded at a solid annualised rate of 4.4% in 3Q25 while productivity growth was even stronger at 4.9%. US productivity typically moves in long cycles (see Figure 1), and current trends suggest the economy may be entering the early stages of a sustained upswing (Figure 1), supported by advances in artificial intelligence (AI). A productivity boom, defined as higher output per hour, represents a positive supply shock, allowing firms to expand output without a proportional increase in labour or capital, thus moderating unit labour costs, supporting profit margins, and easing inflationary pressures even as growth remains firm. This combination is often described as disinflationary growth and is increasingly evident in the US economy today.
Figure 1: US labour productivity (10-year annual rate of change)
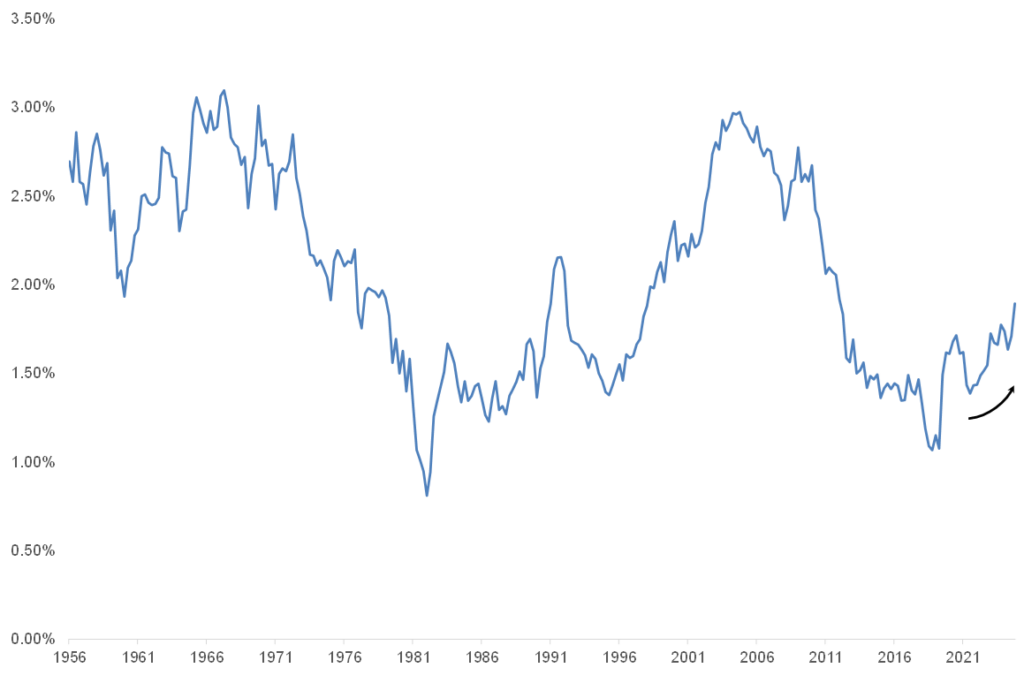
Source: Anchor Capital, FRED
Historic precedent reinforces this view. The US last experienced sustained productivity-led growth in the 1990s, fuelled by rapid internet adoption (Figure 1). During that decade, US real GDP growth averaged a healthy 3.5%, while core inflation declined meaningfully from c. 5.5% to around 2%. US bond yields also moved lower, and the unemployment rate fell from a peak of 8% to sub-4%. What stands out about this period is that inflation declined even as growth remained strong. Often, the two move together. However, this outcome is consistent with the productivity boom theory and provides an important precedent when considering the implications of the current productivity-led cycle.
A key distinction vs earlier productivity cycles is that the US labour market is currently softening rather than strengthening. The increased adoption of AI raises the risk of worker displacement, particularly in white-collar roles, and it remains unclear where many displaced workers could find new employment. The US unemployment rate has already risen to 4.4% from a low of 3.4%, and Job Openings and Labor Turnover Survey (JOLTS) data show job openings have fallen below the number of unemployed workers (see Figure 2). Firms remain cautious, maintaining a low-hiring, low-firing stance.
Figure 2: US labour demand softening – job openings to unemployed persons
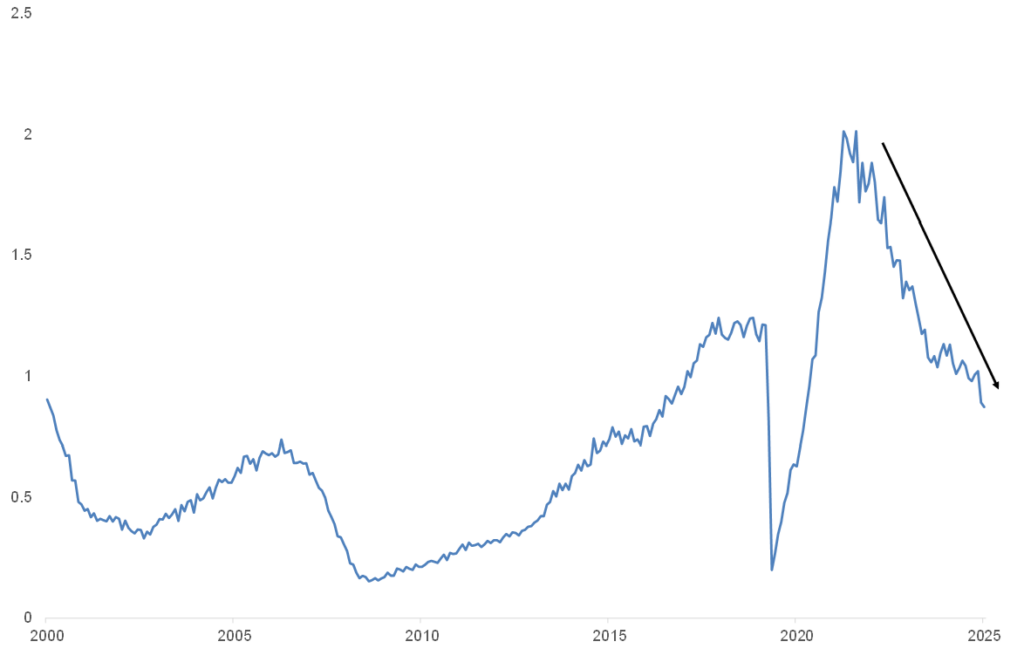
Source: Anchor Capital, FRED
Reliable US labour market indicators, including the Kansas City Federal Reserve’s (Fed) Labour Market Conditions Indicator (LMCI; a composite of two dozen variables and one of the most comprehensive gauges of labour market conditions), point to further upside risk to US unemployment (Figure 3), potentially towards 5% in the coming months.
Figure 3: Softening labour market – unemployment rate likely to push higher
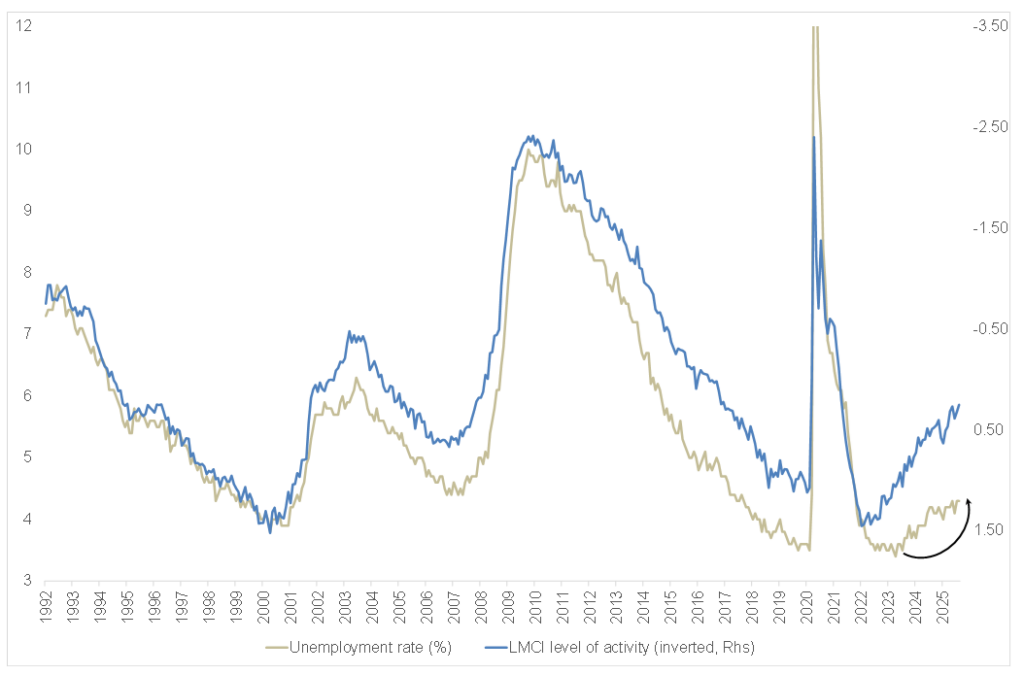
Source: Anchor Capital, FRED
We continue to see other US labour market measures softening. Unit labour costs contracted sharply (-1.9%) in 3Q25, and wage growth continues to moderate. Given the central role of wages in business costs and pricing decisions, sustained weakness in unit labour costs should further ease underlying inflationary pressures. If these trends persist, US inflation could move closer to the Fed’s 2% target or below by year-end – well below consensus expectations, which have core inflation averaging c. 2.8% in 4Q26 (Figure 4). Forecasts for the next three quarters remain elevated but continue to be revised lower, a trend we expect to continue. At the same time, growth forecasts are being revised higher while short-term interest rate expectations trend lower, reinforcing our disinflationary growth outlook.
Figure 4: US core CPI, quarterly YoY % change
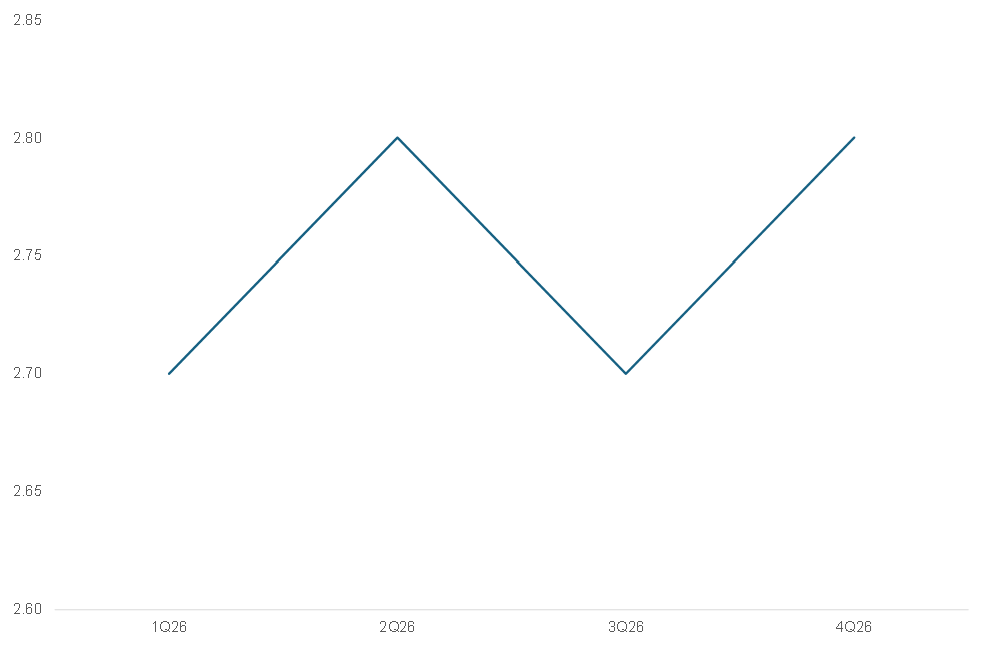
Source: Reuters consensus forecasts, Anchor Capital
While hawks often cite strong GDP growth as a reason for the Fed to pause easing, the composition of growth matters. The current expansion is being driven by productivity gains from AI rather than demand excesses. Moreover, the Fed’s mandate is focused on inflation and employment, not growth per se. When either side of the Fed’s dual mandate comes under pressure, policy typically responds, as evidenced by the three rate cuts delivered last year as labour market conditions softened faster than anticipated and unemployment rose to 4.6%, above the Fed’s estimated long-run equilibrium range of 4.0%-4.3%, suggesting that the maximum employment side of the mandate was no longer being met.
US inflation remains above target but is moving in the right direction. Core inflation can be divided into three components: core goods inflation, which accounts for roughly 25% of the basket; core services excluding shelter – commonly referred to as supercore – which makes up c. 35%; and shelter inflation, which represents the remaining 40% (Figure 6).
Figure 5: US supercore inflation, YoY % change
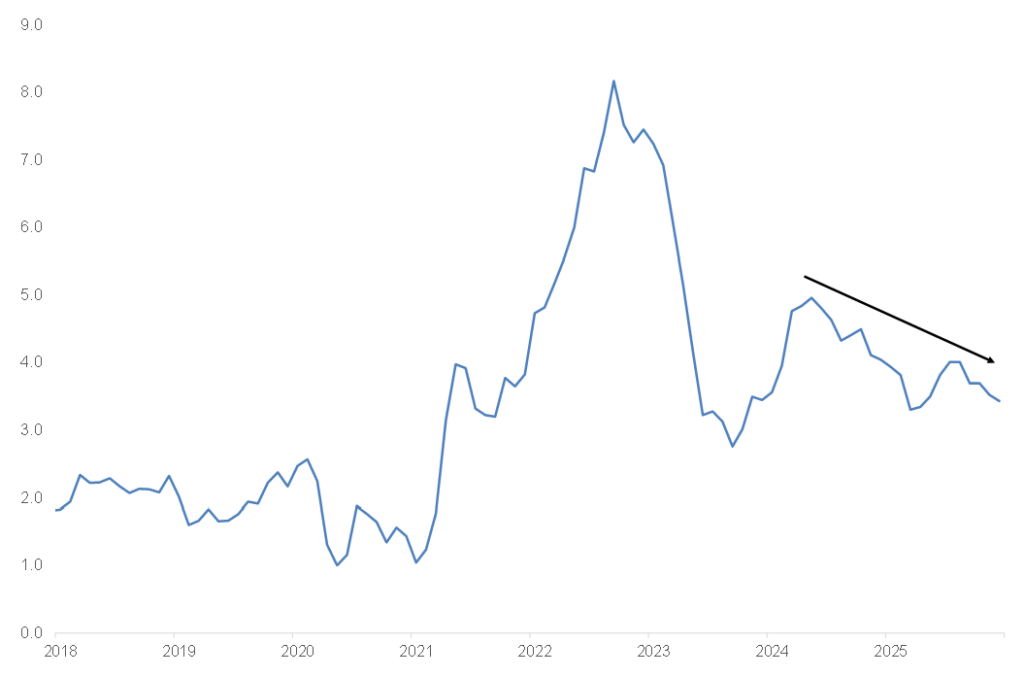
Source: Anchor Capital, FRED
Figure 6: US shelter inflation, YoY % change
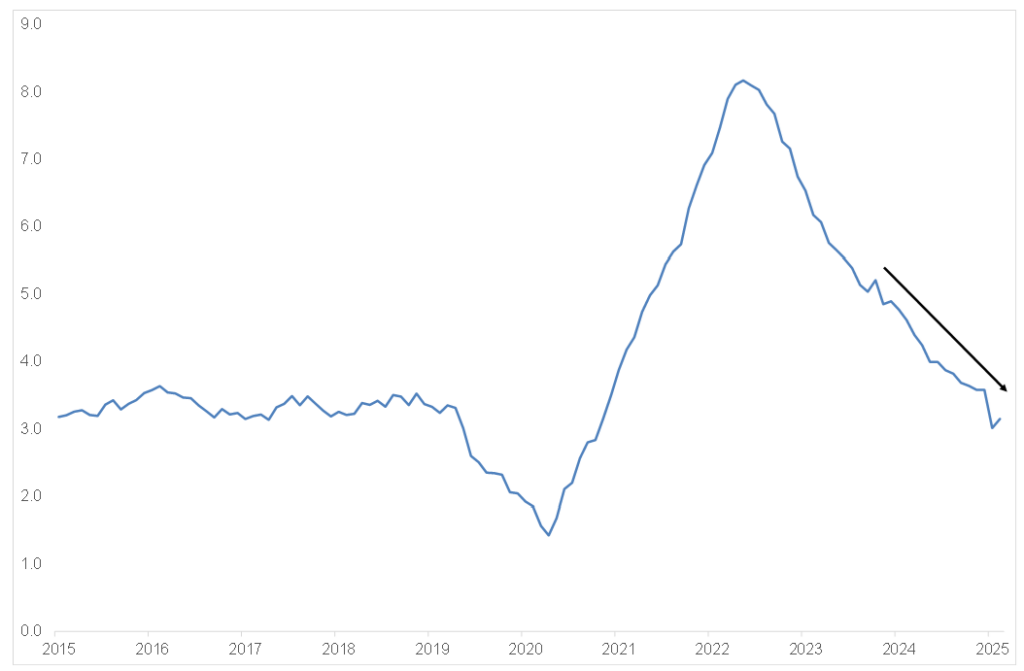
Source: Anchor Capital, FRED
Figure 7: US core goods inflation, YoY % change
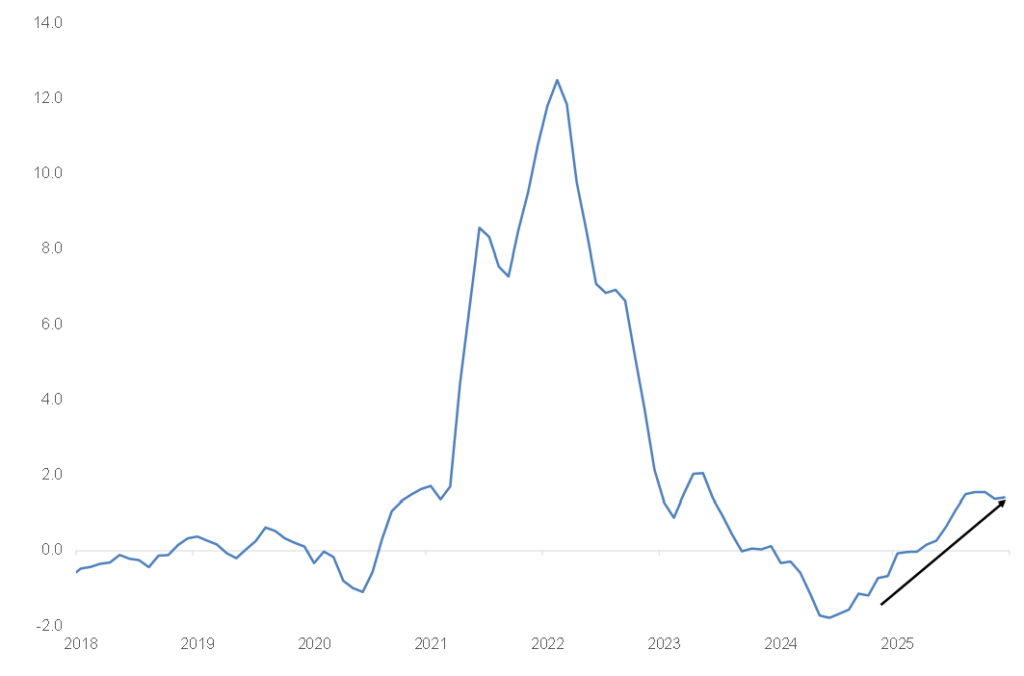
Source: Anchor Capital, FRED
Approximately 75% of the US core inflation basket is currently experiencing disinflationary pressure (Figures 5-9). The recent uptick in core goods inflation largely reflects the temporary impact of tariffs, which are widely estimated to be adding c. 0.4% to overall headline inflation. Absent this tariff effect, core inflation would have been closer to 2.2%.
As the impact of tariffs gradually washes out of the inflation calculation in 2H26, reflecting its one-time nature, core goods inflation should start to moderate, assuming no further tariff escalation.
Figure 8: More disinflation ahead for supercore inflation, YoY % change
Source: Anchor Capital, FRED
Figure 9: More disinflation ahead for shelter inflation, YoY % change
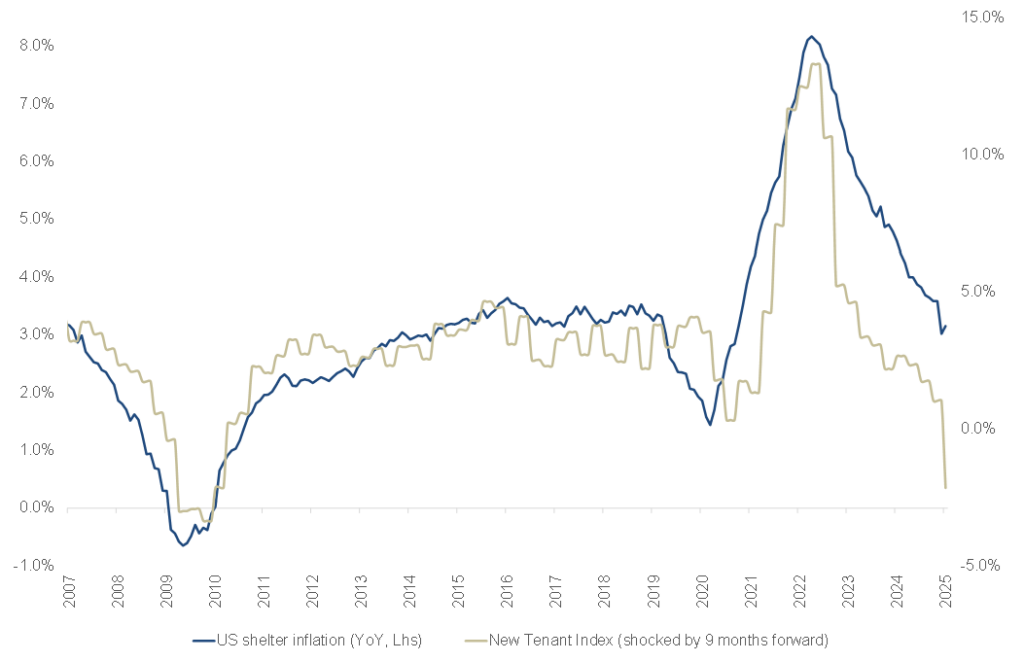
Source: Anchor Capital, FRED, BLS
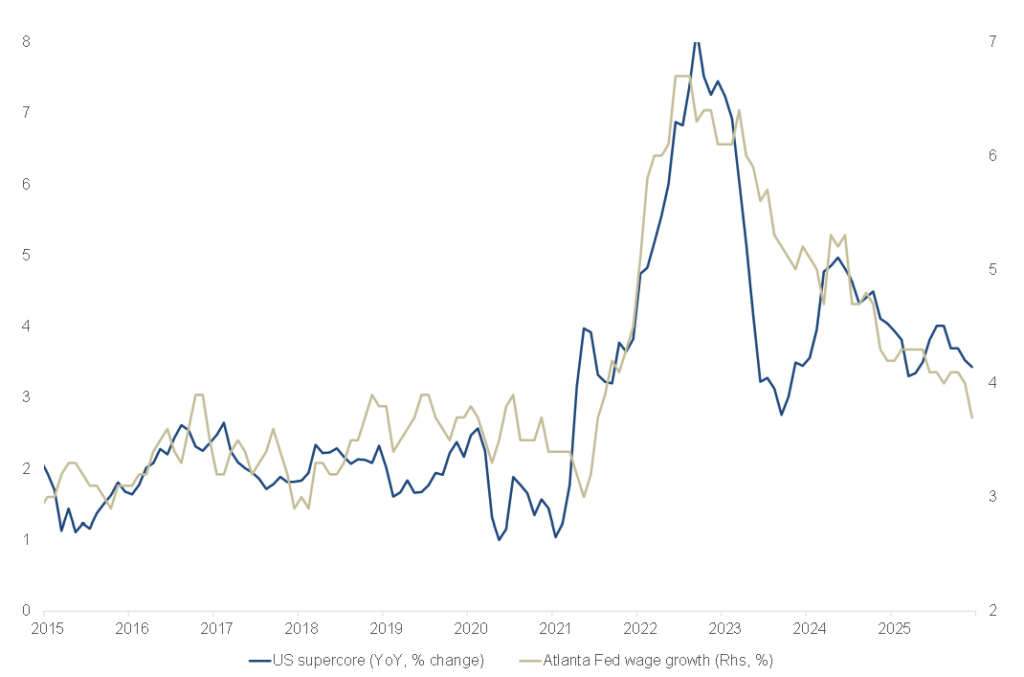
Looking at the other components (namely shelter and supercore), we expect disinflationary pressures ahead in both. Supercore inflation has historically shown a close relationship with wage growth, and as wage pressures continue to moderate, we expect supercore inflation to ease further (Figure 8). In the housing market, the weakness in market rents is pointing to further downside in shelter inflation (Figure 9). This should begin to feed through into the official data (due to lags), with shelter inflation expected to moderate more noticeably over the coming months.
Overall, softer labour and housing markets, combined with fading tariff effects, are likely to continue exerting downward pressure on inflation. As tariff effects gradually fall out of the calculations in 2H26, we expect the whole core inflation basket to experience disinflationary pressures.
We see upside risks to US unemployment and downside risks to inflation in 2026, even as growth remains strong, supported by productivity gains. In such a scenario, the Fed could undershoot both sides of its dual mandate, with employment weakening and inflation moving below target, necessitating more policy easing than is currently priced by markets. Against this backdrop, we believe US Treasury yields should have limited upside. Furthermore, a lower terminal rate will give bond yields more room to fall, especially the 10-year bond yield. The primary risks to the inflation call stem from fiscal policy impulse. At the same time, the US dollar may face headwinds despite good foreign capital inflows, as narrowing yield differentials and elevated geopolitical risks encourage reserve diversification by central banks and sustained FX hedging activity, both of which could weigh on the US dollar over time.