Given the extreme price moves we have seen in Naspers, Prosus, and Tencent shares recently, we highlight that our comments on ratings, etc. in this note can date very quickly. Nevertheless, below we provide some context around where things currently stand. We highlight that what follows is perhaps more aimed at those investors with their fingers on the trigger to sell out of this grouping because we believe these investors should at least understand the extremes we have reached with respect to the ratings and discounts of these counters.
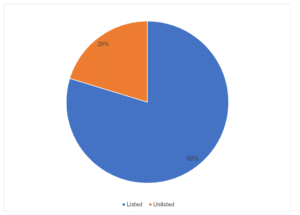
First, a reminder of what the breakdown of the Naspers/Prosus net asset value (NAV) looks like: In Figure 1 below, we highlight the split between those investments that are listed and those that are unlisted in the Naspers/Prosus NAV. Although Tencent dominates the listed part, we note that there are also several other listed investments, of which the stake in Delivery Hero is by far the largest. The important takeaway here is that the high proportion of listed exposure means the Naspers/Prosus NAV is not greatly influenced by subjectivity.
Figure 1: Naspers/Prosus NAV split between listed and unlisted investments
Source: Anchor, Bloomberg
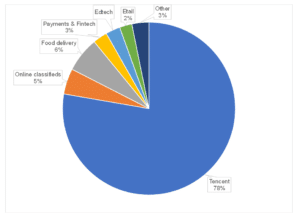
Figure 2 shows the split of the NAV between Tencent and all of Naspers/Prosus’ other investments. Tencent still dominates. At one stage, Tencent accounted for ~90% of the NAV. However. the disposal of two tranches of Tencent shares, proceeds from which have been recycled into other investments, as well as the fall in Tencent’s share price has resulted in its significance declining to some extent.
Figure 2: NAV of all Naspers/Prosus investments vs Tencent
Source: Anchor, Bloomberg
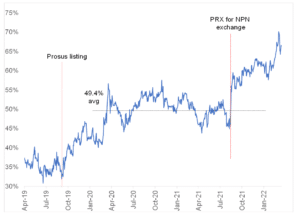
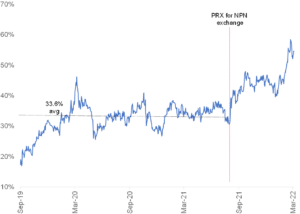
Regarding the current discounts to NAV, in Figures 3 and 4 below we highlight Naspers and Prosus’ discounts to NAV. Both have contracted slightly from the extremes we saw earlier in March, but it is clear these remain extremely elevated relative to their history. As we have said before, with no instrument that forces this discount back towards a “normal” level (whatever that is!), it is dangerous to assume that just because the discount is close to an extreme relative to its history, it cannot go wider.
Still, anyone taking a long-term view here should take significant comfort from the level of discount at which you are entering the trade. It is clear from the fact that the discount has reached this level that Mr. Market is saying that there is no likelihood of anything happening from a corporate action point of view to unlock value. Based on recent feedback from management post the poorly received share exchange transaction in August last year, this market view is probably justified for the time being. However, when things get this extreme, there is certainly a possibility that options that seemed unattractive before now look very different. These discounts are trading so far in excess of the likely tax and transaction costs that might flow from breaking up these groups that we do not think these friction costs are a justifiable excuse for continuing to do nothing, for example.
Figure 3: Naspers discount to NAV
Source: Anchor, Bloomberg
Figure 4: Prosus discount to NAV
Source: Anchor, Bloomberg
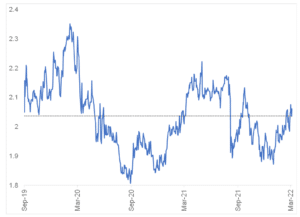
With reference to where the current exchange ratio between Prosus and Naspers is (see Figure 5), the recent upward slope of the curve implies that Prosus has been underperforming Naspers for the last few months. This will come as no surprise to those that follow these two shares closely. Based on the history of this relationship, we are at levels where there does not seem to be a strong case to be made for one over the other in terms of investing new money. Right now, we would recommend Prosus in a tax-sensitive situation and Naspers in a non-tax-sensitive situation. The rationale for this is that future corporate action intended to unlock value is likely to be done in such a way that the benefits from any potential value unlock are shared between Naspers and Prosus shareholders. There may be an additional advantage for Naspers shareholders to opt for such a deal but, as we saw before, this has toxic tax consequences as it is treated as a deemed sale of shares for tax purposes.
Figure 5: Exchange ratio of Prosus shares for Naspers shares
Source: Anchor, Bloomberg
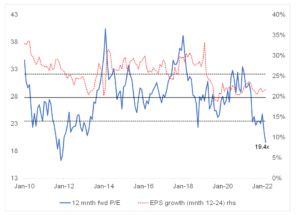
Turning to Tencent, in Figure 6 below we show where the current 12-month forward P/E sits relative to history. Bear in mind that, since around 2015, Tencent has been investing a lot of the strong cash flow it generates into building a portfolio of equity stakes in other tech businesses. These investments have, in aggregate, contributed a small loss to operating earnings on a consolidated basis. Their value has equated to 35%-plus of Tencent’s market cap in recent results. No doubt the value of these investments has also fallen significantly in recent months, and it is fair to say that investors are not attributing any value to them at a Tencent level. It is important to keep in mind though that, if these investments are stripped out of Tencent’s market cap, the implied forward P/E is even lower than what is shown in the chart.
Figure 6: Tencent 12-month forward P/E vs earnings growth expected in year-2
Source: Anchor, Bloomberg
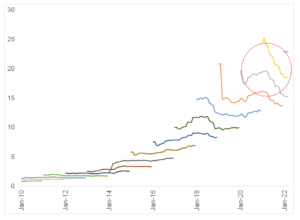
As far as what has been happening to Tencent’s earnings expectations, with reference to Figure 7 below, you can see that there have been significant downgrades to projections over the past year. At Tencent’s 4Q20 results announcement around this time last year, the company gave what amounted to a profit warning, saying that it planned to increase spending (its staff costs have ramped up significantly since), while China’s regulatory crackdown and economic slowdown has hit its advertising business, particularly in recent quarters. Since March 2021, we have seen consensus expectations for FY21, FY22 and FY23 cut by 17%, 22%, and 23%, respectively. If this is correct, it implies that Tencent earnings will be relatively flat this year and then resume growth in the c. 20% CAGR range thereafter.
Figure 7: Trend in consensus earnings for Tencent
Source: Anchor, Bloomberg
Another point to keep in mind with Tencent is that it has been generating more than US$25bn of operating cash flow p.a., with US$5bn-US$6bn of fixed capex coming off that (so close to US$20bn of free cash flow [FCF] p.a.). Tencent has chosen to invest much of this FCF into its investment portfolio mentioned above. Possibly, however, the changing political winds in China may make it more difficult to continue with this strategy going forward. So, what does a company that has very low net debt do with this cash? At Tencent’s current market cap, share buybacks would equate to a c. 4.5% reduction in shares in issue p.a.
Tencent will be reporting its 4Q21 results on 23 March. Currently, sell-side consensus estimates are expecting revenue to grow by about 6% YoY and earnings before one-off items to decline by c. 2% YoY. This would certainly be the weakest quarterly result we have seen from Tencent in a very long time. Going forward, however, investors need to keep in mind that it begins to come up against an increasingly softer base. Of course, China’s zero COVID-induced lockdowns could hit the country’s recovery (although we do note that if the initial lockdown was so positive for Tencent’s gaming revenue because the whole of China was confined to the couch, why should things be so different this time around?), and the impact of China’s regulatory onslaught on tech is still a possible source of risk, although Tencent seems to have been far less impacted than other businesses. Nevertheless, the bottom line is that 4Q21 should represent a low point in Tencent’s growth momentum as things currently stand.
In conclusion, there is a long list of reasons why this grouping of shares has been pushed to the extreme moves we are seeing right now. The ones that come to mind include:
- Naspers/Prosus has recycled all the proceeds from disposals of Tencent shares into loss-making (“long-dated” earnings) technology companies that is thematically in the sin bin as we face rising interest rates. There is no need to look at these companies until that theme changes.
- The thesis that the regulatory barrage in China was finished has been dealt a severe blow by recent developments – the food delivery sector has been told to cut pricing, while Tencent is now facing a fine for WeChat Pay violating money-laundering rules.
- China’s alignment with Russia over that country’s invasion of Ukraine.
- A possible move by China, while the world is focused elsewhere, to annex Taiwan.
- Further political interference in the operations/capital allocation decisions of China tech companies.
- The threatened forced delisting off US exchanges of Chinese companies that do not meet US reporting standards (here we note that Tencent does not have a primary listing in the US).
Although in better times we all wish to see a great entry point into high-flying shares that we might have missed on previous occasions, the reality is that when they get beaten down to this extent, there is a very strong reason (in this case a laundry list of reasons!) as to why that is the case. In many of the complicated geopolitical scenarios that are possible, we must be honest that we do not have the information edge to answer with confidence how they will turn out. We believe that shares trade on the uncomfortable side of certainty – sadly, you will not get that happy combination of certainty on the outcomes on the above risks and the shares still being as beaten up as they are currently. Suffice to say, they are pricing in a pretty dire outcome at this point.


