Naspers and Prosus reported FY22 results on Monday (27 June). However, before we delve into the results review, we highlight that, clearly, much more important than the results announcement, was the news that Naspers and Prosus will be commencing an open-ended, share buyback programme. With Tencent’s agreement, the lock-up that had been in place after the last Tencent selldown has been ended, allowing Prosus to sell Tencent shares to fund the buyback.
A couple of points to highlight on this include:
- The sale of Tencent shares raises cash in Prosus. This is obviously fine for buying back shares in Prosus itself, but it raises the question of how such a buyback is funded at a Naspers level. Prior to the share exchange in August 2021, the Naspers share buyback was done by Prosus buying Naspers shares in the market, resulting in the beginning of a small cross-holding. However, Prosus now owns 49% of Naspers because of the share exchange that was done in August. It cannot go over 50%, as this would trigger Naspers becoming foreign-owned, which in turn requires SA regulatory approval beforehand and would result in significant capital gains tax (CGT) consequences for the Group. One way for Naspers to raise cash would be for it to sell down its Prosus stake. There was also a lock-up on Naspers’ sale of further shares in Prosus after the share exchange. However, this comes to an end in August 2022, and thus, what could potentially happen is that Naspers will sell down its Prosus shareholding and use the cash raised to buy its shares in the open market. As Prosus is doing a share buyback too, it is likely it will be the buyer of its own shares that Naspers is selling.
- The announcement says that the sale of Tencent shares will be limited to 3%-5% of the average daily trading volume (ADTV). On average, Tencent trades around US$1.2bn worth of shares per day, so c. US$40mn-US$60mn/day could be raised through Tencent shares for share buybacks.
- Currently, Prosus owns 29% of Tencent. The announcement does not say anything about how much it would be prepared to sell down. Currently, the Tencent stake is worth US$133bn, so, at the moment, Prosus would raise about US$4.6bn per 1% of Tencent sold down. The board representation that Prosus has at Tencent is not linked to a particular shareholding being maintained, so this is not a determining factor in what level of ownership Prosus will ultimately maintain in Tencent.
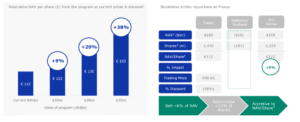
- Obviously, the net asset value (NAV) uplift at a Naspers/Prosus level is going to depend on where the discount is when the buyback is done. Figure 1 below, taken from the results presentation, gives investors a good sense of it at the 56% discount level where it was trading prior to the announcement.
Figure 1: NAV/share enhancement at various levels of buyback at Prosus
Source: Naspers, Prosus
- NAV/share accretion calculations assume current share prices and valuation discounts remain constant.
- NAV at market value as of 22 June 2022 for listed assets and for the unlisted assets, the current average estimates of sell-side analysts, and post-money valuations on transactions where analyst consensus is not available.
- Based on 1,420mn effective shares in Prosus.
- Reflects FX (EUR/US$) impact of 0.947x as of 22 June 2022.
- Reflects Prosus’ price of EUR49.65 (US$52.46) and Tencent’s price of HKD370.00 (US$47.13) as of 22 June 2022.
Regarding Prosus’ FY22 results, we note the following:
- Core headline earnings were USc247/share (-17% YoY) and exactly at the mid-point of Prosus’ recent trading update range. The main contributory factors to the decline were the fact that Prosus sold down 2% of its Tencent stake last year (its main profit-generating investment), while losses in its Ecommerce division (all the other tech investments Prosus has been making) increased as a result of new, earlier-stage investments made, and new growth initiatives being pursued by its investee companies.
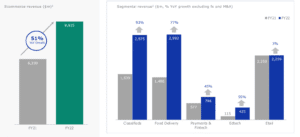
- Regarding revenue growth in its Ecommerce division, as per Figure 2 below, this was strong across all verticals except Etail which benefitted significantly from COVID-19. At the interim stage (1H22), revenue growth for this division stood at 53% YoY, so momentum has moderated slightly. Nevertheless, in the context of how much negativity there has been around the global macroeconomic backdrop this year, this still looks solid to us. This rate of topline growth is also a lot faster than that of Tencent – a consideration for investors deciding whether it is better to own Prosus or Tencent directly.
Figure 2: Prosus – 51% Ecommerce revenue growth driven by growth in each segment
Source: Naspers, Prosus.
- Results reported on an economic-interest basis, i.e., equity-accounted investments are proportionately consolidated.
- As far as the increase in losses in its Ecommerce division is concerned, Prosus has split out the “core” business for each of the above verticals (see Figure 2), which shows that these businesses are scaling well and showing the positive operating leverage that investors would expect. Separately, it also shows the losses as a result of new growth initiatives, for example, autos in Online Classifieds, expansion into grocery delivery in Food Delivery, etc. This is a sensitive area, however, as the recent divergence in performance among listed technology companies has centered on those that are profitable and those that are not. No doubt, investor tolerance for these losses is running low.
- As far as growth in the value of the Ecommerce division is concerned, you can see that the fallout in markets over the past 6 months, as well as the write-off of its Russian assets (Avito mainly), has taken a bite out of its valuation. This presents the picture of what we hope will prove to be its darkest hour. However, it is interesting that, since Prosus was listed in September 2019, more value has been created through corporate action than through growth in its underlying investment portfolio, which is not ideal. In the past, management has disclosed the aspiration to grow the value of the Ecommerce division to US$100mn by 2025, the achievement of which would certainly go a long way towards balancing the Prosus portfolio better between Tencent and the rest. This is notably absent from the latest disclosures, with management acknowledging that market conditions as they appear now, likely make this aspiration a tough ask in the timeframe originally envisaged.
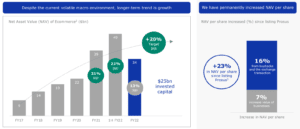
Figure 3: Prosus’ strategy is to grow NAV and NAV/share over the long term
Source: Naspers, Prosus.
- IRR from 2008.
- FY17 to FY21 represents the company value and scheme share value for the performance of SARs and PSUs and should not be viewed as the market value of the portfolio. Instead, they serve to assess the progress and value creation of the businesses, excluding Tencent. 1H22 and FY22’s NAV represent the estimated market valuations using a combination of prevailing share prices for stakes in listed assets and for unlisted assets the average valuation estimates derived from sell-side analysts or post-money valuations of transactions if analyst consensus is not available.
- The NAV and number of shares at Prosus’ listing (11 September 2019) was US$159bn and 1,625mn compared to US$170bn and 1,420mn as at 31 March 2022. This equates to a NAV/share at Prosus’ listing of US$98 compared to US$120 as at 31 March 2022.
- New investments totaled US$6.2bn for the year. This was a massive year relative to the run rate of investment over the past few years. Interestingly, the pace of investment slowed sharply in 2H22 (US$5.2bn in 1H22 vs just US$1bn in 2H22). It was made clear in the results that, in the current environment, the Group is adopting a more conservative investment approach – focusing on funding existing investee growth initiatives and share buybacks, rather than pursuing new investments and technology verticals.
- Free cash flow (FCF) went from a positive US$126mn in FY21 to a negative US$562mn in FY22. Much of this negative swing appears to have been a build-up of working capital in its OLX Autos business. The deterioration in cash generation is not too alarming in the short term as the band does not imply any material risk. However, this is not a trend one would want to see persisting.
In summary, the topline growth rate in its Ecommerce division is very pleasing and reassuring in the current global operating environment. This is offset by the widening losses and deterioration in FCF. The market’s willingness to accept topline growth alone, without much consideration for the profitability thereof, has clearly disappeared. There is no doubt a positive long-term opportunity in the fact that Prosus has the balance sheet strength to continue to invest in the growth opportunities that its Ecommerce division’s investee companies have committed to when many competitors are likely to fall by the wayside for want of funding. The potential for the financially strong to emerge from this tech downturn even stronger is clear. However, for the doubters of the investment case in Naspers/Prosus, beyond them being merely a way to gain exposure to Tencent, the widening Ecommerce division losses in FY22 and comments from the Group FD at the results that these losses are set to grow in the coming year, will do little shift opinion favourably. For the time being, however, this debate is likely to be secondary to what now has the potential to be a material uplift to the NAV/share purely arising because of the share buyback. In addition, after a torrid 18 months for investors in Chinese technology shares, a notable rebound in recent weeks suggests that investors are beginning to gain confidence that the Chinese regulatory reset has run its course, setting the scene for improved investment performance over the balance of 2022. Thus, even after the large rise in the share prices of Naspers and Prosus in response to the share buyback announcement, we believe they remain attractive investment options within the SA market. To be sure, as pleasing as the significant share price rise was, it did not even entirely reverse the losses these shares have suffered just YTD!
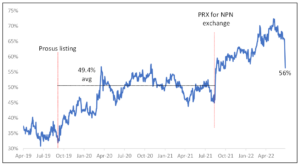
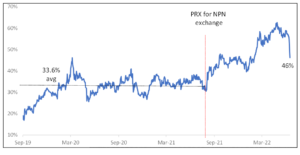
Regarding where the discounts to NAV stand at the moment relative to their histories, one can see in Figures 4 and 5 below that the large rally in both counters on news of the buyback has narrowed the discounts considerably from the extremes reached over the last few months. In both cases, however, the discounts remain relatively wide vs history. With the Group now having the cash firepower available to buy back sufficient shares to be meaningful, there is the means to impact the discount, and therefore a case to be made that we should see the discount narrow further. Management would not be drawn on what level of discount it regards as being acceptable. However, it was clear that it would be happy to continue buying back shares at discount levels well below where they currently stand.
Figure 4: Naspers discount to NAV
Source: Anchor, Bloomberg
Figure 5: Prosus discount to NAV
Source: Anchor, Bloomberg
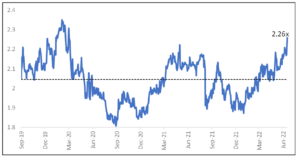
As for the relative preference between Naspers and Prosus at current levels, this is considered from the perspective of the exchange ratio in Figure 6 below. The steadily rising exchange ratio throughout 2022, implies that Naspers has been outperforming Prosus. This likely suggests that investors have been positioning themselves in anticipation of corporate action aimed at narrowing the discount that would favour Naspers shareholders. This outperformance has pushed the exchange ratio to a relative extreme vs history. For investors that are not sensitive to tax by switching between the two, in the short term at least, there is a growing case for some reversal in favour of Prosus. No doubt, the announcement of the share buyback is a new development that may cause European institutional investors to revisit the investment case for Prosus – this could certainly drive renewed investment interest in Prosus specifically. For new investors considering an entry, we would recommend a balanced exposure to the two at these levels, since the wider discount in Naspers continues to provide the optionality of a larger value unlock in the event of future corporate action to address the discount.
Figure 6: Exchange ratio – number of Prosus shares to buy one Naspers share
Source: Anchor, Bloomberg


