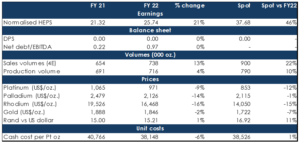
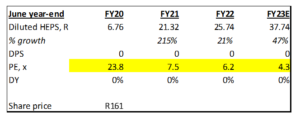
Northam Platinum (Northam) reported lacklustre FY22 results (for the year ended 30 June 2022) on Friday (26 August). Headline earnings per share (EPS) declined 2.9% YoY, and earnings before interest, taxation, depreciation, and amortisation (EBITDA) were 1.2% lower YoY at R16.5bn. Northam attributed the FY22 decrease in profit (-7.6% YoY) to soaring costs, community unrest, and lower-than-forecast growth at its Booysendal mine. Its net debt also increased to R16bn on the back of the company’s costly expansion strategy, including acquiring a stake in Royal Bafokeng Platinum (RBPlat). We are estimating earnings growth of 47% for Northam over the next year (the Bloomberg consensus analysts’ estimates are for 59% growth over the same period). There are two major drivers of that growth. First, production volumes from Northam’s operations will grow by 10% at the midpoint of the guidance range. Second, Northam had an inventory build-up this past fiscal year that will be drawn down in FY23. The combination of both these factors gets FY23 total sales volumes up by 22% YoY.
Figure 1: Northam overview and forecasts, in Rbn unless otherwise indicated
Source: Anchor, Bloomberg
Volume growth
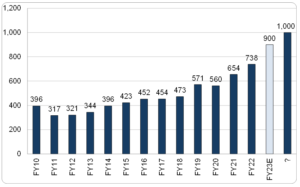
Northam aims to reach 1mn 4E ounces (4E = four platinum group elements, namely platinum, palladium, rhodium, and gold) of annual production volumes from its operations (Figure 2 below shows sales volumes rather than production volumes).
Figure 2: Northam sales volume (4E), ’000 ounces
Source: Anchor, Bloomberg
The table in Figure 3 below shows that the major platinum group metals (PGM) miners generally have no volume growth. Northam is the exception, consistently growing volumes close to 10% p.a. over the past decade. Sibanye-Stillwater’s (SSW’s) PGM volume growth numbers below are flattered by acquisitions. SSW’s PGM business also started off a low base, and we expect its PGM volumes to grow closer to the numbers shown by Implats and Amplats below going forward.
Figure 3: Major PGM miners’ compound annual growth rates (CAGR) over various periods

Source: Anchor, Bloomberg
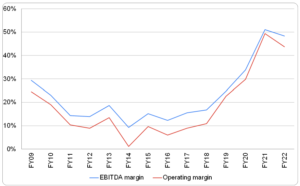
Margins remain high vs its history.
Figure 4: Northam operating and EBITDA margins, FY09-FY22
Source: Anchor, Bloomberg
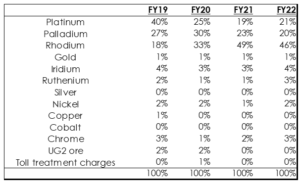
Rhodium and palladium still account for c. two-thirds of Northam’s total revenue.
Figure 5: Northam revenue by metal
Source: Anchor, Bloomberg
Figure 6: Northam earnings outlook
 Source: Anchor, Bloomberg
We have been sellers of the PGM sector coming into this reporting season, and we continue to be underweight PGMs. Nevertheless, our preferred pick in the sector is Northam because of its peer-leading volume growth of c. 10% p.a., which puts it in a better position than its peers to deal with a PGM basket price no longer increasing and very strong mining cost inflation. We estimate that Northam is trading at just over 4x FY23 earnings (see Figure 6 above). While we are underweight the PGM sector, our preferred pick remains Northam.
If you have any questions or would like to discuss the subjects raised in this article with someone at Anchor please email us at info@anchorcapital.co.za.


