Most global equity markets ended February on a higher note (MSCI World +4.3% MoM/+5.6% YTD), with the US, Japan, and China leading the outperformance, while South Africa (SA) and the UK lagged. February’s strong performance was despite continued concerns around China’s economy, worsening Middle East geopolitical tensions, a higher-than-expected January US inflation print, and US Federal Reserve (Fed) officials talking down expectations of an imminent rate cut. February also marked the fourth straight positive month for US markets, which have been steadily rising since November on the back of expectations that the Fed was done with hiking interest rates to curb the highest US inflation in c. 40 years, and instead, it would start cutting soon.,
In US economic data, January headline inflation, as measured by the Consumer Price Index (CPI), came in above expectations at 3.1% YoY. Although it was lower than December’s 3.4% YoY print, consensus economists’ forecasts had expected a 2.9% rise. US job growth also exceeded forecasts, indicating that economic growth may remain too robust to bring inflation closer to the Fed’s 2% target rate. January core CPI, excluding the erratic food and energy components, rose 3.9% YoY, unchanged from December. MoM headline inflation increased by 0.3%, while core inflation accelerated by 0.4%. January US retail sales declined by 0.8% MoM vs December’s downwardly revised 0.4% MoM gain. YoY, retail sales rose 0.6% in January vs December’s 5.6% rise. January core personal consumption expenditure (PCE), excluding food and energy, the Fed’s preferred inflation gauge, slowed to 2.8% YoY compared to 2.9% YoY in December, still above the Fed’s goal (it targets a 2% annual inflation rate) but not exceeding market expectations. MoM, January core PCE rose 0.4% vs 0.2% in December.
All three major US benchmark indices ended February higher. The Dow rose 2.2% MoM (+3.5% YTD), while the tech-heavy Nasdaq Composite (+6.1% MoM/+7.2% YTD) closed at an all-time high of 16,091.92 on 29 February, as tech stocks and chips counters rallied into the close. The blue-chip S&P 500 Index jumped 5.2% MoM (+6.8% YTD), hitting an all-time high on 22 February of 5,111.
Major European markets also increased in February, with Germany’s DAX gaining 4.6% MoM (+5.5% YTD), while France’s CAC closed 3.5% higher (+5.1% YTD). In economic data, January euro area inflation slowed to 2.8% from 2.9% YoY in December, while European Union (EU) annual inflation came in at 3.1% in January, down from 3.4% in December, according to Eurostat. Germany’s January inflation rate stood at 2.9% YoY – the lowest level since June 2021 and below December’s 3.7% YoY print. MoM inflation was at 0.2% in January. France’s January inflation slowed to 3.1% YoY vs December’s 3.7% print, driven by slowing food and energy costs. The country’s core inflation (excluding food and energy prices) also declined, reaching 3.0% in January from 3.4% YoY in December.
In February, the UK’s blue-chip FTSE-100 retreated by 0.01% (-1.3% YTD). January UK inflation held steady at 4.0% YoY – unchanged from December. The UK slipped into a recession in 4Q23, as gross domestic product (GDP) growth dropped 0.3% YoY, following an unrevised decline of 0.1% YoY in 3Q23.
China’s moribund stock market continued to face headwinds in February. Still, it closed the month with good gains as investor sentiment seemingly stabilised, likely weighing the potential for more stimulus against concerns about the effectiveness of current attempts by the government to shore up the economy. Tighter regulations, state-led buying, and property market stimulus measures also aided the equity markets’ performance. Nevertheless, structural issues (an ageing population, public debt buildup, and real estate turmoil) remain and are expected to mute China’s growth outlook this year. Hong Kong’s Hang Seng Index jumped 6.6% MoM (-3.1% YTD), its best performance since January 2023, while the Shanghai Composite Index soared 8.1% MoM (+1.4% YTD). China’s 4Q23 GDP growth came in at 5.2% YoY, which is also the annual rate for GDP growth in 2023. The GDP print was assisted by the base effects from the country’s strict lockdowns in 2022, but it was nevertheless the lowest growth rate (excluding the COVID-19 pandemic) since 1990. China’s official February Manufacturing Purchasing Managers Index (PMI) contracted for a fifth consecutive month, coming in at 49.1 vs January’s 49.2 print. The official non-manufacturing PMI, measuring business sentiment in the services and construction sectors, rose to 51.4 in February vs 50.7 in January. The 50-point mark separates expansion from contraction.
Japan’s equity market was again an exceptional performer in February, with the benchmark Nikkei ending 7.9% up (+17.0% YTD) after hitting a fresh high on 26 February, when it closed at 39,233.71 (the index breached its 1989 all-time high of 38,915.87 on 22 February). Japan’s core CPI, excluding the volatile fresh food category but including energy costs, slowed in January, coming in at 2.0% YoY vs December’s 2.3% print. While the reading was higher than the consensus forecast, it was the lowest in c. 22 months.
Among commodities, oil prices recorded another increase in February (+2.3% MoM/+8.5% YTD), as OPEC+ is expected to extend production cuts, and the latest US PCE inflation data came out in line with forecasts. After declining in January, the spot gold price ended February 0.2% higher (-0.9% YTD). The platinum price fell 4.6% MoM (-11.3% YTD), while palladium dropped 3.6% (-14.0% YTD). Iron ore’s decline (-9.4% MoM/-12.6% YTD) also showed no sign of abating as a lack of demand for Chinese steel weighed on prices. During the Lunar New Year holiday period, steel inventories also piled up while consumption slowed.
The JSE again lagged major global and emerging markets. The FTSE JSE All Share Index was down 2.4% in February (-5.4% YTD), while the FTSE JSE Capped SWIX retreated by 2.3% MoM (-5.0% YTD). Property counters were the best performers on the JSE for a third month running, with the SA Listed Property Index creeping 0.8% higher in February (+4.9% YTD), while the resources sector continued to experience volatility with the Resi-10 yet again the laggard – declining by 7.2% last month (-12.6% YTD). The Fini-15 lost 0.8% MoM (-3.7% YTD), while the Indi-25 retreated by 0.6% (-2.1% YTD). Highlighting the monthly performances of the biggest shares on the JSE by market cap, the largest company on the exchange, BHP Group, was down 4.5% MoM. In comparison, the second- and third-biggest shares – Anheuser-Busch InBev and Richemont gained 0.6% and 8.9% MoM, respectively. Prosus and Naspers advanced slightly – by 0.5% and 0.6% MoM, respectively. Other large-cap counters, such as Glencore, dropped 9.2%, while British American Tobacco (BAT) rose by 3.0%, MoM. The rand continued to weaken against the US dollar, down 2.7% MoM (-4.4% YTD).
In local economic data, January headline CPI moved higher to 5.3% vs 5.1% YoY in December after easing for two consecutive months. MoM, CPI crept up by 0.1% in January. Core inflation (excluding food, fuel, and electricity) rose to 4.6% YoY in January vs December’s 4.5% print – indicating that recent headline pressures are becoming more entrenched in the greater inflation basket. This latest print also means that SA inflation has moved further away from the 4.5% midpoint of the SA Reserve Bank’s (SARB) target band, although it remains within the central bank’s 3%-6% range. Seasonally adjusted SA December retail sales (released in February) grew 2.7% YoY vs November’s revised 1.0% YoY decline. MoM seasonally adjusted retail trade sales increased by 1.4% in December.
National Treasury’s (NT’s) 2024/2025 Budget was tabled in Parliament on 21 February amid an even more challenging economic and socio-political environment than previous iterations, given the upcoming national elections, the decades of policy inertia and years of state capture that preceded it. As expected, it did not introduce any new, significant populist policies or spending measures before the upcoming elections. Instead, NT continues to toe the line between fiscal continuity, consolidation, and declining revenues amid an increasingly stagnant local economy. Notably, to help mitigate SA’s growing debt burden, NT has decided to reduce its borrowings over the medium term by using a portion of valuation gains in the Gold and Foreign Exchange Contingency Reserve Account (GFECRA) held at the SARB. As such, the government will receive R150bn in distributions from the SARB over three fiscal years. As a result, debt-service costs will decline by R30.2bn over the 2024 Medium Term Expenditure Framework (MTEF) period compared with the 2023 Medium Term Budget Policy Statement (MTBPS) estimate, reducing local market financing requirements and the growth of debt stock and debt-service costs.
Figure 1: February 2024 20 best-performing shares, MoM % change
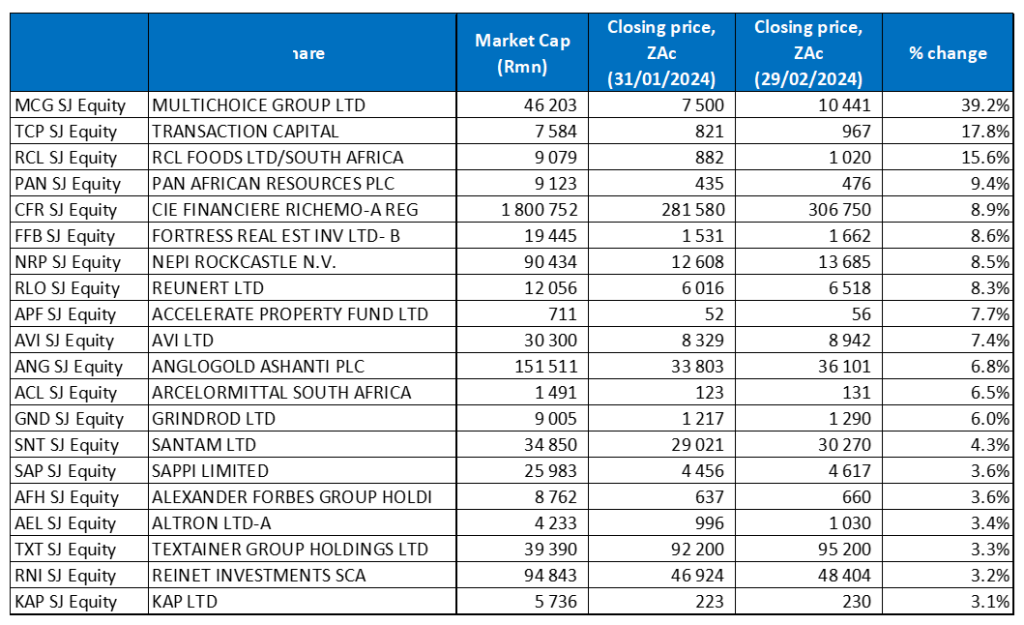
Source: Bloomberg, Anchor
In another lacklustre month on the JSE and following a stellar start to the year, property counters again proved to be the exception, with three of the top ten performers coming from the sector. However, property’s outperformance has been somewhat skewed, mainly driven by UK- and Europe-focused stocks (rand-hedges) and local property companies’ growing footprints in offshore markets.
Still, while property counters gained ground, Multichoice was by far the best-performing share on the local bourse, soaring by 39.2% MoM. The company released a cautionary announcement on 1 February, indicating that it had received an offer from Vivendi’s Canal+ Group (a French media company), which already owns more than one-third of MultiChoice, to acquire the remaining shares at R105.00/share. The cautionary was subsequently withdrawn after an analysis by the MultiChoice Board concluded that the R105.00/share offer significantly undervalues the business. However, the Board has indicated that it remains open to engaging with any future parties regarding offers at a fair price – within the ambit of the applicable takeover regulations. The MultiChoice share price ended the month at R104.41 after hitting R105 in mid-February – the first time since May 2023. This has pressured Canal+ to increase its offer for Africa’s largest pay-tv provider.
In second place, investment holding company Transaction Capital, which saw its share price plummet 75.9% in 2023, jumped by 17.8% in February after it announced its intention to raise R900.0mn to R1.25bn by selling some shares in WeBuyCars ahead of a planned unbundling and separate listing.
RCL Foods was February’s third best-performing share, rising 15.6% MoM. The company released a 1H24 trading update, announcing that it expects HEPS from total operations to be at least 30% higher YoY while EPS from total operations would be at least 100% higher YoY.
RCL was followed by Pan African Resources, Richemont, and real estate investment trust (REIT) Fortress Real Estate (Fortress) with MoM gains of 9.4%, 8.9% and 8.6%, respectively. Gold producer Pan African Resources reported interim results for the six months ended 31 December 2023, which showed that its revenue rose to US$193.95mn from US$156.49mn posted in the corresponding period of the previous year, while basic and diluted EPS advanced 46.1% YoY to USc2.22. The company said that an increase in production and a rally in the gold price lifted its profit for the six months by c. 46% – production increased c. 7%, and the gold price rose 14% in the period under review.
After over 90% of Fortress shareholders approved its latest proposal to end the company’s A and B share structure, Fortress finally collapsed the dual share structure to only one class of shares. In a trading update, it announced the implementation of the scheme where it repurchased all Fortress B shares in issue in consideration for 0.060207 NEPI Rockcastle shares for every FFB share in issue, together with the conversion of all the Fortress A shares in issue into FFB shares. In January, Fortress confirmed that dividend payouts will recommence in March when its results for the six months to December are announced. Management said it had kept its policy of paying out 100% of distributable earnings to shareholders.
Last month, NEPI Rockcastle (+8.5% MoM) reported record FY23 distributable earnings per share (DEPS) of EUc56.98 – up 9.3% YoY. Operating income soared 21% YoY to EUR491mn, while distributable income (DI) rose 17% YoY, supported by 13% like-for-like rental income growth and a reduction in the tax rate. The company’s FY23 tangible net asset value (TNAV) was at EUc695 (+1% from 1H23).
NEPI was followed by Reunert (+8.3% MoM), Accelerate Property Fund (+7.7% MoM) and consumer goods Group AVI Ltd (+7.4% MoM), which rounded out the ten best-performing shares for February. Despite AVI’s consumer brands businesses facing a challenging operating environment, including ports and loadshedding challenges, the company expects to lift its consolidated HEPS by between 16% and 18% YoY for the six months to 31 December 2023.
Figure 2: February 2024 20 worst-performing shares, MoM % change
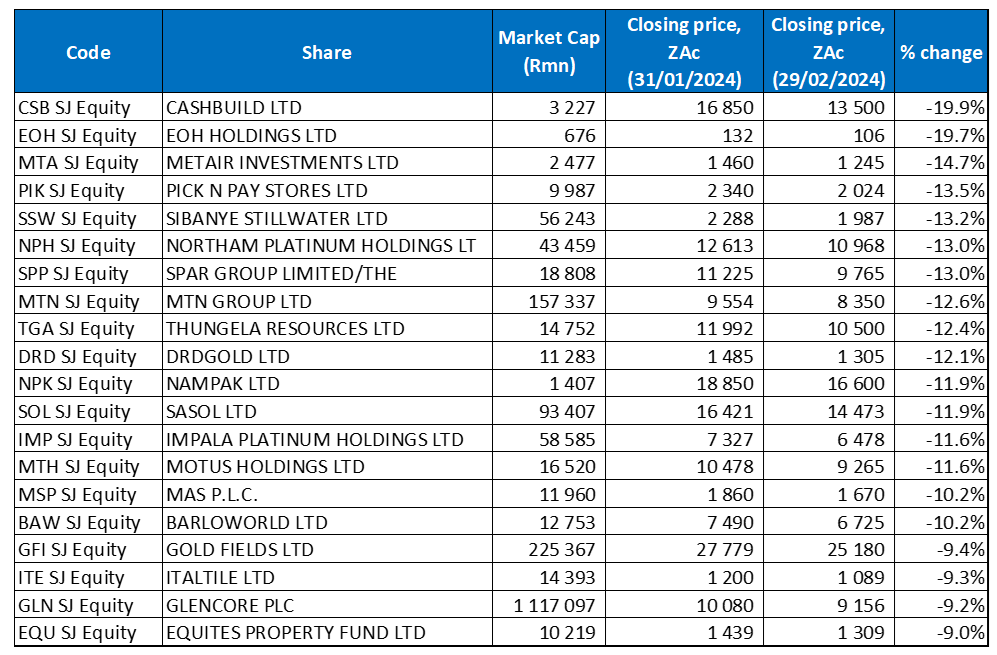
Source: Bloomberg, Anchor
Building materials retailer Cashbuild Ltd (-19.9% MoM) was February’s worst-performing share. The company reported 1H24 results in February, which showed that revenue rose 2.5% YoY to R5.8bn, while headline EPS dropped to R5.52 compared with the R6.94 reported in 1H23. This is as local consumers continue to face pressure from higher rates and ongoing loadshedding. Despite a low base in the same period a year earlier (1H23), Cashbuild said that its profit fell 20% YoY, noting that the “… results are testimony of the financial strain of the consumer, exacerbated by continued loadshedding and above-inflationary cost increases,”. The retailer also impaired R137mn of the book value of its P&L Hardware business, indicating it is less valuable than recorded. As a result, operating profit decreased by 81% YoY and EPS by 98% YoY. Cashbuild bought the P&L business (which has 53 stores) in 2015.
EOH Holdings (-19.7% MoM) was last month’s second worst-performing share. In a trading update for the six months to end-January 2024, the company said that it expected “… muted GDP growth forecasts and the high unemployment rate will continue to make for a challenging trading environment for the foreseeable future”. Last week, EOH also said it would pay the SA Revenue Service (Sars) R112mn to settle a PAYE dispute involving its unit, EOH Abantu. This closes the Group’s last significant legacy issue dating back to 2012 and comes ahead of CEO Stephen van Coller’s departure (he retires at the end of March). EOH’s current chair, Andrew Mthembu, will take over as CEO from 1 April.
Automotive components manufacturer and battery maker Metair Investments was the third worst-performing share, down 14.7% MoM.
In a trading update released on 22 February, Pick n Pay (-13.5% MoM) said it had recorded another disappointing period, with sales down 0.1% for the 47 weeks ended 21 January 2024. The company also announced that its board has signed off on a new strategy to raise R4bn through a rights offer to shareholders and a separate listing of its successful Boxer business. The proceeds will stabilise its balance sheet while priming it for longer-term sustainable growth. This comes after Pick n Pay suffered an R570mn loss after tax for the six months ended August 2023, which, together with increased inventory levels and strategic investment into Boxer, Pick n Pay Clothing and asap!, has led to a marked increase in its net debt – from R3.8bn at 1H24 to R7.2bn at 21 January 2024.
Pick n Pay was followed by precious metals producer Sibanye Stillwater and Northam Platinum (Northam), with MoM declines of 13.2% and 13.0%. Sibanye-Stillwater said in February that it would swing to a loss in the year to end December, warning its annual profit plunged by as much as 91% last year, mainly due to a sharp decline in PGM prices and production bottlenecks. The miner expects to post FY23 HEPS of between R0.60 and R0.66 – down from R6.52 reported in FY22. Meanwhile, Northam’s share price plunged following a trading update as investors responded negatively to the R800mn loss on the disposal of the shares it held in Impala Platinum (Implats), following Implats’ mandatory offer to Royal Bafokeng Platinum (RBPlat) shareholders. Northam received R9bn in cash after selling its 34.5% interest in RBPlat to Implats, and the 3.3% stake it obtained in Implats through the mandatory offer was sold for R3.1bn. However, due to a decrease in the value of Implats’ shares between the time Northam accepted the offer and sold the shares, the deal resulted in an R800mn loss for Northam. The Group’s HEPS for the period is also expected to decline between 87.5% and 97.5% YoY.
Spar Group, MTN, Thungela Resources, and DRD Gold rounded out the ten worst-performing shares with MoM share price losses of 13.0%, 12.6%, 12.4% and 12.1%, respectively. In its trading update for the 20 weeks ended 16 February 2024, Spar delivered a resilient trading performance with turnover increasing by 9.3% for the period. Total wholesale sales increased by 5.6%, and combined core grocery and liquor turnover rose by 6.1% YoY. Moreover, its pharmaceutical business delivered strong turnover growth of 11.6%, with both Pharmacy at Spar and Scriptwise trading robustly during the period.
MTN said last week it expects to report a 60%-80% YoY drop in FY23 HEPS, weighed down by non-operational issues and a sharp devaluation in the Nigerian naira vs the US dollar. The Group’s Nigerian business has been under pressure, with the country’s economy battered by the increased cost of living, reducing disposable incomes for consumers and made worse by the change in Nigeria’s currency regime.
In its trading statement for the year ended 31 December 2023, Thungela said it expects HEPS to be between R31 and R36, a decrease of between R94.82 and R99.82/share compared to HEPS of R130.82 for the prior period – a YoY decrease of between 72% and 76%.
Finally, gold miner DRDGold reported a slight drop in output amid a delay in commissioning four new sites to replace high-volume sites that had reached end-of-life. Nevertheless, the company posted a 10% YoY rise in its interim profit.
Figure 3: Top-20 best-performing shares, YTD
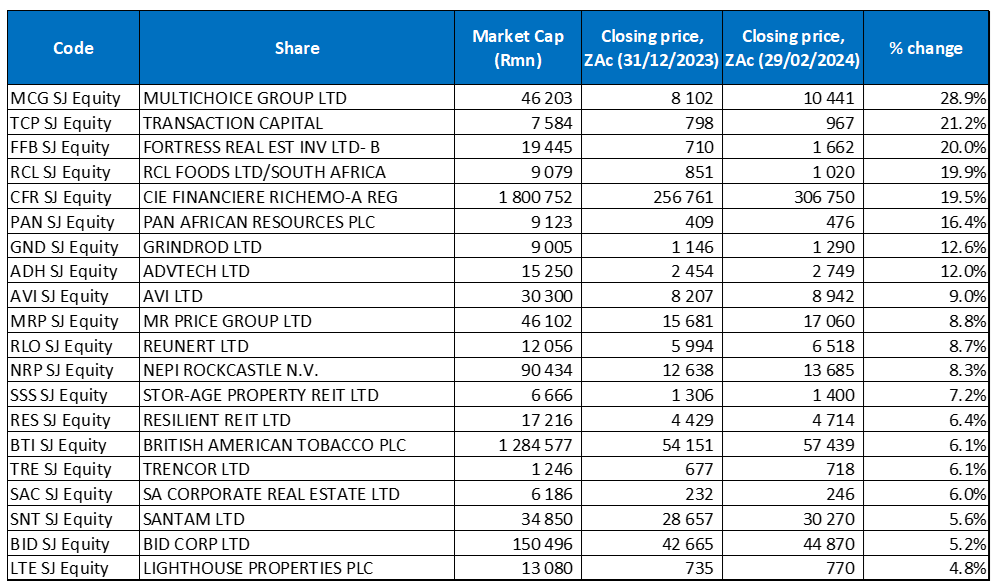
Source: Anchor, Bloomberg
The YTD best-performing shares significantly overlapped with February’s best performers discussed earlier. YTD, Multichoice also took the top spot with a 28.9% gain. Transaction Capital also came in second position, advancing by 21.2%. It was followed in third place by Fortress, which is up c. 20% YTD.
On a YTD basis, RCL Foods dropped to fourth place with a gain of 19.9%. RCL was followed by Richemont, Pan African Resources and Grindrod with YTD advances of 19.5%, 16.4% and 12.6%. Grindrod released a positive FY23 trading statement last week, saying that HEPS from continuing operations (which includes all segments except Grindrod Bank, disposed of in November 2022) is expected to increase by between 33% and 39% YoY to between Zac148.7 and ZAc154.7.
Rounding out the ten best-performing shares YTD were private education provider ADvTECH (+12.0%), AVI (+9.0%) and Mr Price (+8.8%). Mr Price’s latest trading update, released in January, surprised positively, with the retailer reporting 9.9% YoY sales growth to R13.2bn in its third quarter to the end of December. It also experienced a bumper festive season, with retail sales jumping over 15% in December 2023. Mr Price said it had gained market share for a fifth consecutive month while improving its trading margins.
Figure 4: Bottom-20 worst-performing shares, YTD
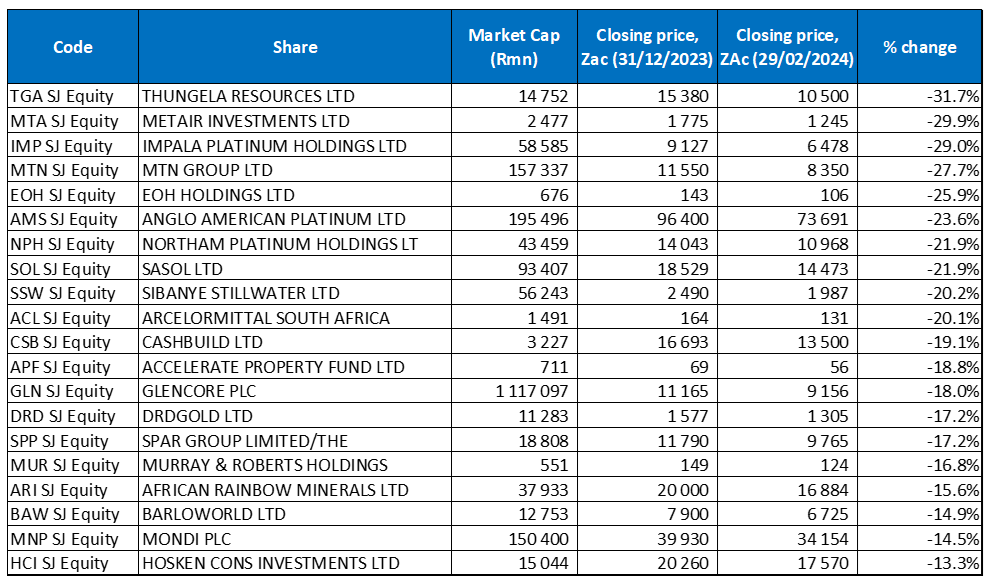
Source: Anchor, Bloomberg
There was also an overlap between the YTD worst-performing shares and February’s worst performers discussed earlier. MoM Thungela took the dubious honour of worst performing share YTD with a 31.7% loss. It was followed by Metair (-29.9% YTD) and Implats (-29.0% YTD) in second and third position, respectively. Implats reported mixed 1H24 results, impacted by a downturn in PGM prices. Its revenue fell by 25% YoY to R43.4bn from R57.8bn posted in 1H23, while diluted EPS stood at ZAc180.0, compared with ZAc1,644.0 recorded in the same period of the previous year.
Implats was followed by MTN (-27.7% YTD), EOH (-25.9% YTD), Anglo American Platinum (Amplats -23.6% YTD) and Northam (-21.9% YTD). Amplats also reported disappointing FY23 results, which showed that gross revenue fell to R124.6bn from R164.1bn posted in FY22, while diluted EPS plummeted by 73.5% YoY to R49.47. Profit plunged by 71% YoY to R14bn due to declining PGM prices, loadshedding, which saw production drop by 82,000 ounces, and cost containment strategies. Last month, Amplats also said it was restructuring its operations, which could result in the loss of 3,700 jobs and the closure of its Mortimer shelter.
Sasol, Sibanye Stillwater, and ArcelorMittal SA (AMSA) rounded out the ten worst performers YTD with losses of 21.9%, 20.2%, and 20.1%, respectively. Sasol’s 1H24 results showed that its turnover declined to R136.3bn from R149.8bn posted in 1H23, while diluted EPS fell by 40.6% YoY to R13.58. Weaker oil and petrochemical prices conspired with unstable product demand and inflationary pressures to weigh on the company’s financial performance. In its FY23 results, released in early February, AMSA said that its revenue rose to R41.6bn from R40.8bn posted in FY22, while it reported a diluted loss per share of ZAc352.0, compared with EPS of ZAc236.0 recorded in the previous year.