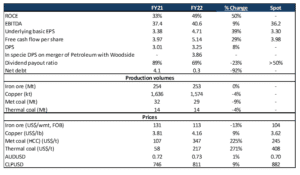
BHP Group reported FY22 results for the year ended 30 June 2022 on 16 August. The world’s biggest miner recorded underlying earnings of US$40.6bn (c. R667bn) and free cash flow (FCF) of US$24.3bn on higher coal and copper prices and disciplined cost control. BHP’s debt declined, and it announced a final dividend of US$1.75/share, bringing its total FY22 cash dividends to US$3.25/share or US$16.5bn in total payments to shareholders – the highest in its history.
This was a decent set of results given the environment. The balance sheet is now basically at a net cash position (net debt is US$333mn). BHP continues to pay a healthy proportion of earnings out via dividends. However, we note that there is little volume growth in BHP’s portfolio, so going forward, the direction of earnings depends on what commodity prices do. We currently expect FY23 earnings to be down 17% YoY (Bloomberg consensus forecasts expect a 25% YoY decline).
The biggest drag on earnings is iron ore, where prices were down 20% vs the FY22 average. The share is trading at 8.7x FY23 earnings and an 8% dividend yield. This seems a fair valuation given the prospect of earnings declining in FY23 and the portfolio mix (coal prices are at all-time highs whilst iron ore prices have more than halved from their 2021 highs but are still quite high relative to history).
Figure 1: BHP Group overview and forecasts, in US$bn except per share

Source: BHP Group, Bloomberg, Anchor
Iron ore operating profit was down 20% YoY to US$5bn. Iron ore volumes were flat, but iron ore prices were down 13% YoY. It was really BHP’s coal business (both met coal and thermal coal) that drove Group earnings growth, adding an incremental US$9bn to its operating profit.
Figure 2: BHP Group underlying EBIT by commodity, US$bn

Source: BHP Group, Bloomberg, Anchor
Despite the drop in iron ore profits, it still accounts for more than half of operating profit.
Figure 3: BHP Group underlying EBIT by commodity, %

Source: BHP Group, Bloomberg, Anchor
As Figure 4 shows, volume growth for FY22 is essentially flat across BHP’s portfolio.
Figure 4: BHP Group volume growth by production, actual and guidance

Source: Company data
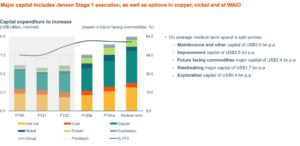
Capex is guided to increase by 50% in the next two years and by 100% over the medium term vs FY22.
Figure 5: BHP Group increasing capital spending on future-facing commodities

Source: BHP Group
Note: Medium term refers to FY25-FY27. FCF – future-facing commodities. Major capital represents projects >US$250mn.
If you have any questions or would like to discuss the subjects raised in this article with someone at Anchor, please email us at info@anchorcapital.co.za.


