Global equity markets plunged after US President Donald Trump’s tariff announcement on 2 April, with many countries vowing to introduce retaliatory measures. Adding to the confusion (which included tariffs on uninhabited islands near Antarctica) and extreme market volatility were Trump’s whiplash-inducing on-again/off-again announcements that followed his initial ill-conceived promulgation.
Trump’s trade war and wild vacillations ignited fears of a US recession, amid slowing growth, weak consumer sentiment and sticky inflation, providing a potentially disastrous cocktail for markets as unprecedented US policy uncertainty resulted in one of the most volatile months in recent history (MSCI World +0.9% MoM/-1.7% YTD). Never a dull moment with Trump, as investors were also on tenterhooks after he threatened to remove US Federal Reserve (Fed) Chair Jerome Powell, despite having initially appointed him in 2018 (Trump walked back those threats).
The International Monetary Fund (IMF) described it as a “new era” where the “global economic system that has operated for the last 80 years is being reset” and predicted rapidly slowing economic growth, particularly in the US, with inflation set to reignite. Still, towards the end of April, the market turmoil had taken a breather after Trump backed away from his initial grandiose plan, announcing a 90-day pause on tariffs to allow for negotiations (although he kept pressure on China by raising duties to 125%). US equities rallied for a sixth straight day on 29 April amidst a flurry of corporate earnings reports before disappointing US GDP data (preliminary 1Q25 GDP fell for the first time since 1Q22, contracting 0.3% QoQ vs 4Q24’s 2.4% growth), saw the major indices tumbling on Wednesday morning (30 April) before clawing back losses and ending the day up. The VIX, which measures the US stock market’s expectation of volatility, soared to 52.33 on 8 April, before closing the month at 24.70 (it stood at 17.35 on 31 December).
The rapid reordering of global trade dynamics caused tremendous confusion and unease among investors, weighing on US and global equity markets. After reaching a record high on 19 February, the S&P 500 dropped by 18.9% to a low on 8 April before some recovery saw it end the month 9.4% down vs its February high (a 10% decline from a peak is considered a correction, while a 20% drop is regarded as a bear market). MoM, the S&P retreated 0.8% (-5.3% YTD), while the Dow fell 3.2% MoM (-4.4% YTD). The tech-heavy Nasdaq, which entered bear-market territory in early April, achieved a 0.9% MoM gain (-9.7% YTD).
US March headline inflation, as measured by the Consumer Price Index (CPI), eased more than expected, printing at 2.4% YoY vs February’s 2.8%. Core CPI, excluding food and energy, rose 2.8% YoY (the lowest core inflation rate since March 2021). However, April US consumer confidence declined for a fifth consecutive month, falling to levels not seen since the COVID-19 pandemic, as uncertainty related to Trump’s trade policies lifted inflation expectations. The April Consumer Confidence Index (CCI) dropped to 86, significantly below March’s revised 92.9 reading and lower than the 88 reading consensus economists had expected. March core personal consumption expenditure (PCE), excluding food and energy, the Fed’s preferred inflation gauge, rose 3.5% YoY – a sharp uptick from February’s 2.8%.
While European equity markets were mixed, the euro recorded its strongest MoM gains against the greenback in three years. It surged by c. 5% in April as optimism over Germany’s fiscal spending plan buoyed the unit while Trump’s economic policies undermined the dollar. For April, Germany’s DAX rose 1.5% (+13.0% YTD), while France’s CAC closed 2.5% in the red (+2.9% YTD). Eurozone headline inflation continued to ease in March, declining to 2.2% YoY vs February’s 2.3% print, while core inflation was down to 2.4% – its lowest point since October 2021.
The UK market also ended weaker in April, with the FTSE 100 down 1.0% (+3.9% YTD). March UK inflation eased for a second consecutive month to 2.6% from 2.8% in February. Core inflation also slowed slightly, reaching 3.4% vs February’s 3.5%.
The impact of harsh tariffs on Trump’s primary target, China (facing broad-based tariffs of 145% on all goods bound for the US and excluded from the 90-day tariff pause), weighed on Asian markets, and Chinese equities ended April in the red. Hong Kong’s Hang Seng fell 4.3% (+10.3% YTD), while the Shanghai Composite was down 1.7% (-2.2% YTD). China’s official April manufacturing PMI saw a notable slowdown to 49.0 from March’s 50.5. The print is a 16-month low, as Trump-imposed trade tariffs hurt bilateral trade. The non-manufacturing PMI, which includes services and construction, also fell to 50.4 from 50.8 in the prior month. A reading above 50 reflects expansion, while a reading below 50 suggests contraction.
Japan’s benchmark Nikkei clawed back some of its March losses, ending April 1.2% higher (-9.6% YTD) despite ongoing concerns over the adverse impact of US tariffs on the country’s economy. Japan’s March core inflation accelerated, printing at 3.2% from February’s 3.0% YoY – in line with expectations.
Among commodities, on the back of ongoing global trade tensions and heightened US tariff threats, investors continued to flock to gold (+5.3% MoM/+25.3% YTD), with the price of the yellow metal reaching another record high of US$3,500.05/oz in April. Among platinum group metals (PGMs), platinum fell 2.8% MoM (+6.9% YTD), palladium was down 4.7% MoM (+3.5% YTD), and rhodium dropped by 5.7% MoM (+17.5% YTD). Brent crude (-15.5% MoM/-15.4% YTD) sold off on an unexpected agreement by OPEC+ producers to increase supply, a move that came at a time when recession fears escalated and concern mounted that demand for travel and shipping would plummet.
In South Africa (SA), most sectors ended the month higher despite worries over the possible unravelling of the government of national unity (GNU), combined with escalating global trade tensions, weighing on the JSE earlier in the month. The FTSE JSE All Share Index rose by 3.3% in April (+8.9% YTD), with its gains far more broad-based than in March, while the Capped SWIX ended 4.2% higher MoM (+5.9% YTD). The Listed Property Index was the star performer with a 6.1% MoM gain (+2.1% YTD), followed by industrials (Indi-25 +4.9% MoM/+8.8% YTD). The Resi-10 rose by 2.3% MoM (+35.3% YTD), primarily due to the gold counters as PGMs retreated. It was followed by financials (Fini-15 +2.2% MoM/+0.4% YTD). The rand weakened by 1.5% MoM against the US dollar (+1.3% YTD).
In domestic economic data, March headline inflation surprised on the downside, coming in at 2.7% YoY, below market expectations and February’s 3.2% print, primarily driven by a continued decline in fuel prices and a lower-than-usual education cost increase. MoM, inflation eased to 0.4%, pointing to a broad-based deceleration in price pressures. Core inflation also moderated, slowing to 3.1% YoY (+0.5% MoM) in March, down from 3.4% YoY (+1.1% MoM) in February, suggesting a continued easing in underlying inflationary pressures across the domestic economy. Meanwhile, the 0.5% VAT hike in the Budget, which was set to kick in on 1 May, was scrapped, with a third attempt at getting the Budget passed being tabled in Parliament on 21 May.
Figure 1: April 2025’s 20 best-performing shares, MoM % change
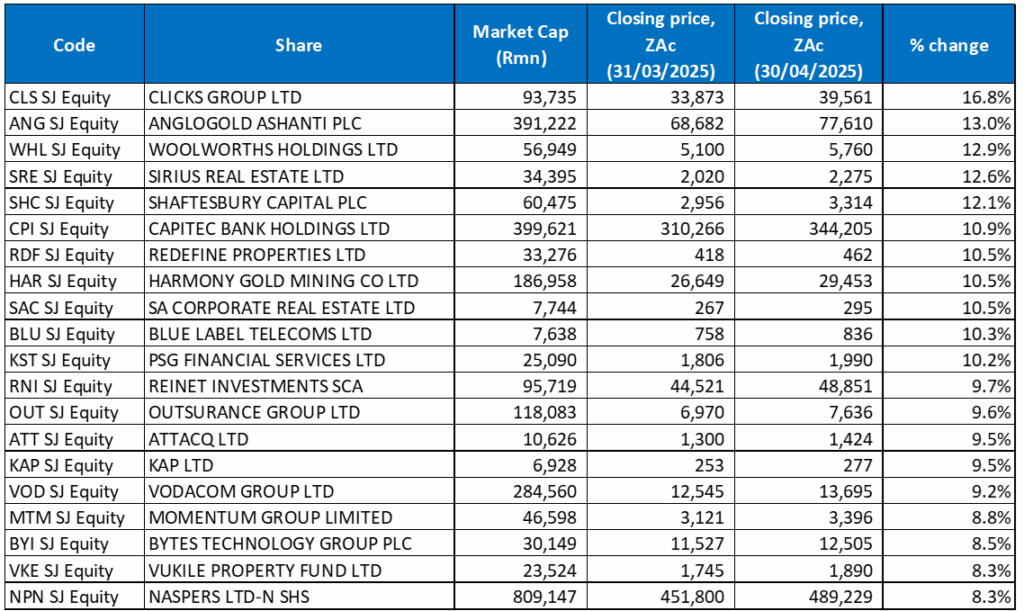
Source: Bloomberg, Anchor
After a dismal performance so far this year, real estate counters rebounded in April with the SA Listed Property Index soaring 6.1% MoM, as several property counters featured among the month’s best-performing shares. In addition, after a lacklustre performance YTD, local retailers seem to be staging a comeback with Clicks Group (+16.8%) emerging as April’s best-performing share. Clicks posted good half-year results boosted by market share gains in its health and beauty segments, stronger private label performance and better margins, with headline earnings per share (HEPS) up 13.2% YoY to ZAc604, while its turnover increased 6.2% to R23.2bn. As its ambitious expansion plan continues, the company plans to open 55 new chain stores and an equal number of pharmacies this year.
In second place, AngloGold Ashanti gained 13.0% MoM, buoyed by the stronger gold price. Last month, the gold miner agreed to sell its interests in two gold projects in Côte d’Ivoire and simultaneously acquire a project in Guinea, alongside its Siguiri operations. Gold and gold shares have rocketed over the past few months as investors turn to gold assets for safety from the ongoing market turmoil. AngloGold was followed by food and clothing retailer, Woolworths (+12.9% MoM), in third place.
Property counters, Sirius Real Estate and Shaftesbury Capital, followed with gains of 12.6% and 12.1% MoM. Last month, Sirius, which owns and operates branded business and industrial parks in the UK and Germany, said in a trading update that it expected a 12.8% YoY increase in rent roll for the year ended 31 March 2025, driven by strong organic growth, ongoing asset acquisitions, and robust demand for space at its business parks. It added that similar levels of growth were achieved in both Germany and the UK (the UK property market has been especially strong over the past two months). Sirius said its second half saw robust growth in occupancy as its strategy began to bear fruit. The in-house asset management platform was pivotal in balancing rate increases while maintaining a healthy occupancy mix, allowing for further growth within the portfolio. Meanwhile, Shaftesbury, a London-focused real estate investment trust (REIT), with a R100bn portfolio, appears poised for a comeback amid a rise in UK tourism. In March, the Norwegian sovereign wealth fund, Norges, bought a non-controlling 25% stake in its Covent Garden portfolio for GBP570mn. It provided a welcome cash injection to help it settle debt and expand its West End footprint.
Capitec Bank (+10.9% MoM) reported excellent FY25 results in April, with headline earnings jumping by 30% YoY to R13.7bn despite a challenging economic climate. The bank said it now serves more than half of SA’s adult population (its active client base exceeds 24mn). Capitec proposed a final dividend of R44.25/share, bringing its total payout for the year to R65.1/share. After announcing the results, Capitec briefly took the top spot as the JSE’s biggest bank by market cap.
Capitec was followed by Redefine (+10.5% MoM), Harmony, SA Corporate Real Estate (+10.5% MoM), and Blue Label Telecoms. In line with ongoing gains in the gold price (+5.3% MoM), Harmony Gold Mining was up 10.5%, while Blue Label Telecoms’ share price has been on a tear recently (+10.3% MoM). In the case of Blue Label, this is due to a combination of factors, including its strong earnings forecasts and positive developments related to mobile operator Cell C, in which it has a significant stake. Blue Label expects to report surging earnings for the full year, which has boosted investor confidence in the counter. Additionally, Cell C has seen signs of a recovery, switched up its management and announced a “brand refresh” in August 2024, while the consolidation of its debt with Blue Label could lead to a stronger balance sheet.
Figure 2: April 2025’s 20 worst-performing shares, MoM % change
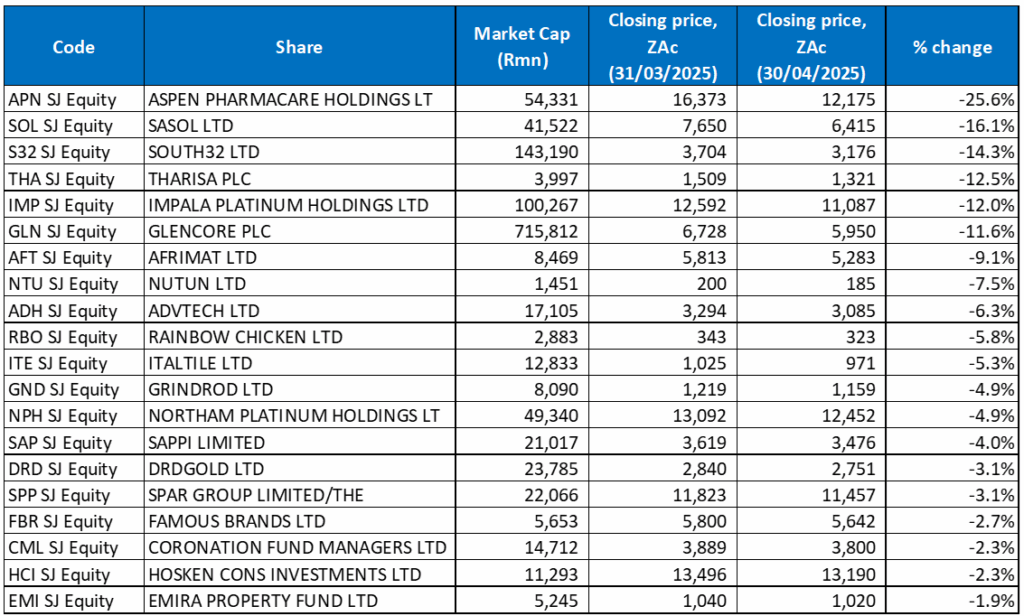
Source: Bloomberg, Anchor
Aspen Pharmacare was April’s worst-performing share with a 25.6% MoM drop. Aspen’s share price plunged as much as 33% on 23 April before recovering slightly (down c. 30% on the day), after the Group said on 22 April that a contractual dispute could cut its FY25 core earnings by almost half (or as much as R2bn). The dispute, which Aspen described as a “material contractual dispute,” relates to a manufacturing and technology agreement, specifically impacting its production facility in France. The potential negative impact on earnings and the loss of value on its investment in mRNA technology led to the share price drop. Aspen did not disclose the company involved in the dispute, saying only that it related to a manufacturing and technology agreement for mRNA products requiring sterile manufacturing facilities. Aspen said an impairment of R770mn in related technology could also arise because of the dispute.
Sasol, down 16.1% MoM, was April’s second worst performer, with South32 Ltd (-14.3% MoM) in third spot. Sasol’s share price has been on a downward trajectory for a while, reflecting a series of operational and financial hurdles that have weighed on the fuel and chemicals giant. These include operational challenges such as the extraction of low-quality coal from Sasol’s mines, diminished natural gas volumes transported from Mozambique, and inadequate feedstock supply, which have hampered production. Rising unit costs at its Secunda facility have compounded the challenges. A looming increase in carbon tax, driven by reductions in tax-free allowances, and a sharp downturn in global oil and chemicals prices have further weighed on Sasol’s investment case.
After soaring in March, platinum, palladium and rhodium prices fell in April, weighing on PGM companies, including Tharisa Plc (-12.5% MoM), and Impala Platinum (Implats; -12.0% MoM). The shares were down despite PGMs (along with coal, gold and manganese) being specifically excluded from Trump’s new tariff structures. According to the Minerals Council, PGMs accounted for 76.3% of total SA mineral and precious metals exports to the US and were worth R65.3bn in 2024.
Glencore’s (-11.6% MoM) share price fell as the miner and commodities giant reported a disappointing 1Q25 production update. The Group posted a 30% YoY decline in copper output (used in everything from data centres to electric cars) during the quarter to 167,900 metric tonnes. Concerns over the widespread impact of Trump’s tariffs have weighed on copper prices this year. However, market commentators believe that demand will remain resilient during the ongoing transition away from fossil fuels towards cleaner energy. Glencore’s 1Q25 nickel production also fell 21% YoY, but cobalt output rose by 44% YoY, thanks partly to an uptick in volumes at its Mutanda mine. Glencore left its 2025 production outlook unchanged, saying that it projects that profit this year at its trading unit will be in the middle of its long-term annual guidance of US$2.2bn to US$3.2bn.
Last month, Afrimat (-9.1% MoM) said in a trading statement that it expects its full-year headline earnings to drop by as much as 90% on the back of changes in the iron ore market, given the rand value received on iron ore exports and the volume reduction from ArcelorMittal SA in the first half of the financial year, which has severely impacted it. The mid-tier mining and materials Group said that HEPS for the year ended February 2025 are expected to be between ZAc56.7 and ZAc85.1, representing an 85%-90% YoY decline. In addition, Afrimat noted that losses from cement and a weaker-than-expected performance from anthracite have also hindered its performance.
Omnichannel Business Process Outsourcing (BPO) services Group, Nutun Ltd, private education provider ADvTECH and Rainbow Chicken, a supplier of chicken products and animal feed, rounded out April’s ten worst-performing shares with MoM declines of 7.5%, 6.3%, and 5.8%, respectively. Rainbow’s share price has been under pressure due to various factors, including a challenging operating environment with high input costs and record imports. While Rainbow has made progress in improving its profitability and has been working on its turnaround strategy, the industry continues to face challenges, including competition from cheap imports and the need for capital investment.
Figure 3: Top-20 best-performing shares, YTD
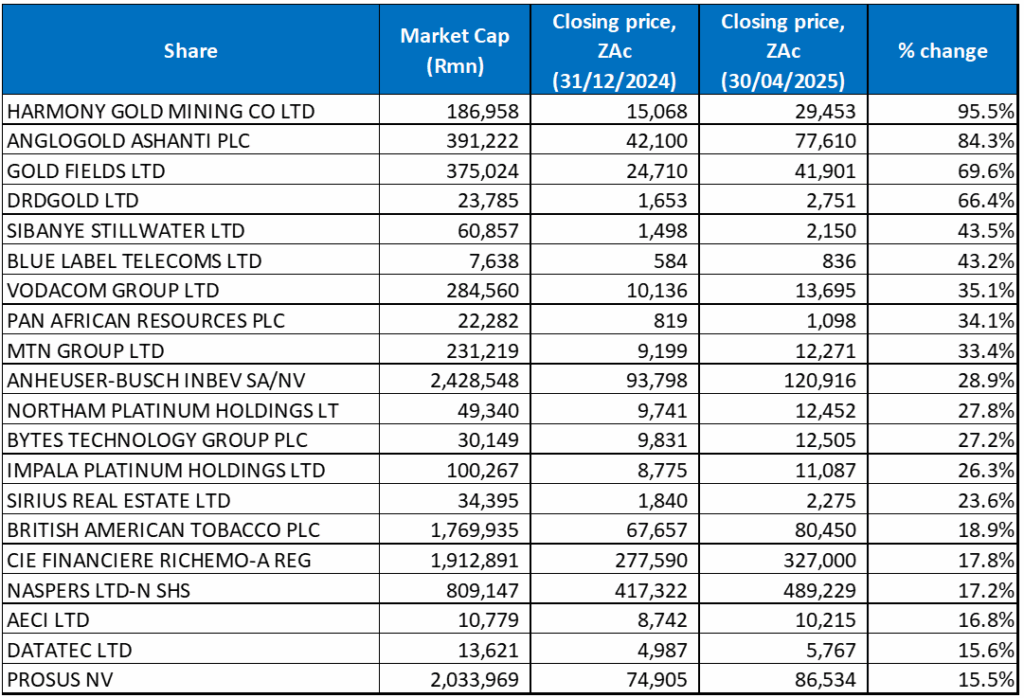
Source: Anchor, Bloomberg
The YTD best-performing shares (to end April) overlapped with those to the end of March as gold miners, whose prices for the most part gained further ground in April on the back of the gold price continuing to test new highs, again featured prominently among the YTD best performers. Nineteen of the year-to-end March’s 20 best performers remained in the year-to-end April, with only one new share entering the top 20 – Naspers -N-.
Harmony (discussed earlier) was once again the top performer YTD with a gain of 95.5%. It was followed by AngloGold Ashanti, Gold Fields, and DRDGold with YTD increases of 84.3%, 69.6%, and 66.4%, respectively.
Sibanye Stillwater, Blue Label Telecoms (discussed earlier), Vodacom and Pan African Resources recorded YTD advances of 43.5%, 43.2%, 35.1% and 34.1%. Mobile operator Vodacom’s share price has risen as confidence in the Group’s strategy grows and it continues to report a robust financial performance despite the challenging economic environment (high interest rates and constrained consumer demand). Vodacom has been buoyed by revenue from its so-called “beyond mobile” streams (digital, financial, fixed, and internet of things [IoT] services), which have continued to show good growth. In February, Vodacom said it expected to grow its earnings by at least 10% between 2025 and 2030, on the back of its international business. The Group’s Egypt business is expected to grow at a CAGR of 20%.
MTN Group (+33.4% YTD) and Anheuser Busch InBev (+28.9%) rounded out the ten best-performing shares YTD.
Figure 4: Bottom-20 worst-performing shares, YTD
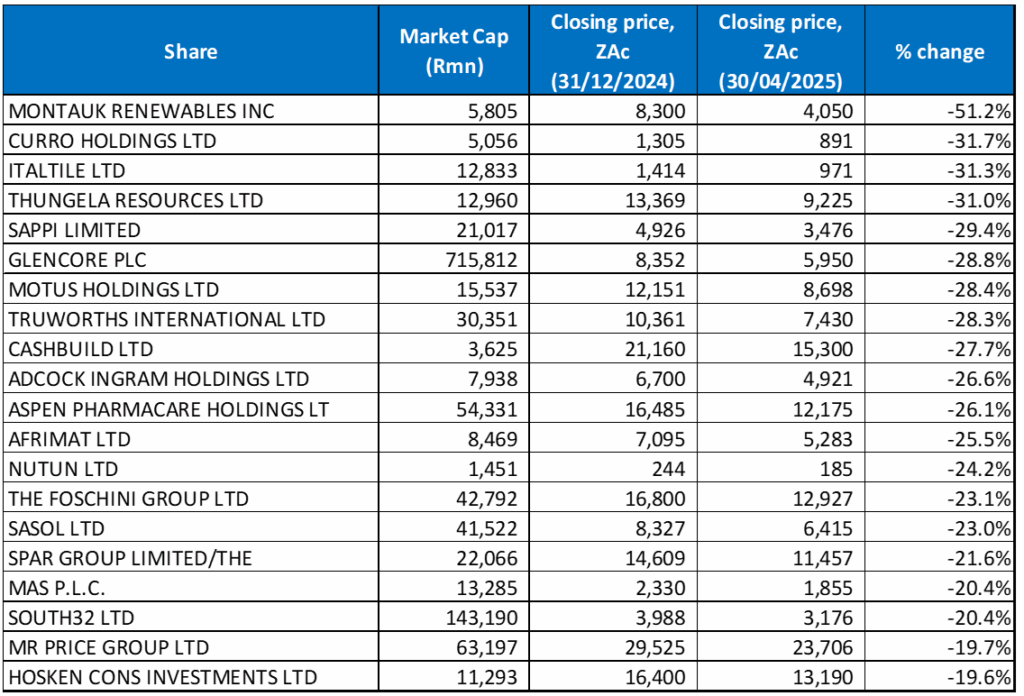
Source: Anchor, Bloomberg
There was also an overlap between the year to end-March’s worst-performing shares and the worst-performers to the end of April (YTD), with fifteen shares unchanged and five new entrants to the grouping – Aspen, Nutun, Sasol, South32, and Hosken Consolidated Investments (HCI).
While Montauk Renewables (-51.2%) remained the worst performer YTD for a second consecutive month, its share price did record a 4.4% MoM gain in April. The firm, which converts the biogas released by US landfills into renewable natural gas (RNG) for electrical energy and is listed on the JSE and the Nasdaq, broke ground on a new project in Oklahoma last month. It expects to invest between US$25mn and US$35mn in the project by its subsidiary Tulsa LFG, which it aims to commission in 1Q27. After the Group announced the new project on 10 April, Montauk’s share price jumped by 9.25% on the day.
Montauk was again followed by Curro (-31.7% YTD) in second place and Italtile (-31.3% YTD) in third position. Italtile’s (-5.3% in April) share price has been on a downward trajectory as it faces economic headwinds, weaker consumer spending, and operational disruptions tied to SA’s rising crime rates. Last month, it was reported that Italtile had been forced to close some of its stores in high-risk areas due to security concerns, leading to increased operating costs and operational disruptions.
Italtile was followed by thermal coal producer and exporter Thungela Resources (-31.0% YTD), Sappi (-29.4% YTD), Glencore (-28.8% YTD; discussed earlier) and Motus Holdings (-28.3% YTD). Thungela’s share price has been under significant pressure due to falling coal demand and prices. Since 2023, China and India have bought less thermal coal, weighing on Thungela’s revenues. Weakening economic growth in China due to its trade war with the US means that demand for thermal coal is likely to drop even further.
Finally, Truworths (-28.3% YTD), Cashbuild (-27.7% YTD), and Adcock Ingram (-26.6% YTD) rounded out the ten worst-performing shares. In April, building materials retailer Cashbuild reported a 5% YoY rise in 3Q25 revenue, as transactions through the tills rose by 7% YoY. The company said that for its 308 existing stores, revenue increased by 4% YoY, while its 11 new stores contributed 1% to revenue growth. Combined with the results reported for the first half, this equated to a 5% YoY rise in YTD revenue. Meanwhile, pharma group Adcock reported lower profit at the interim stage, with the Group’s operational and financial performance affected by sector-specific factors. Its revenue decreased 0.6% YoY to R4.7bn due to a slowdown in its independent and pharmaceutical wholesale channels. HEPS declined by 9.4% YoY to ZAc265.5.