Source: www.hedgeye.com
Executive summary
- Investors are concerned about the potential inflationary impact of disrupted supply chains, combined with excess liquidity and a faster-than-expected global economic recovery.
- In addition, investors are worried that higher inflation will force central banks to respond with tighter monetary policy and remove conditions that have helped facilitate above-average valuations for stocks.
- Lockdowns resulted in global industrial production falling by 12.5% over the first four months of 2020, causing major supply chain disruptions. However, industrial production recovered swiftly and by the end of October 2020 it was only 2% below its pre-pandemic level.
- Researchers estimate that c. 30% of all stimulus directed at US households was saved, leaving US households with approximately $1trn of excess savings – the equivalent of about 7% of American household consumption expenditure (HCE) in 2019. This is likely to fuel excess consumption demand in the short term, though this impulse will be transitory and, as such, the US Federal Reserve (Fed) will not respond to it, in our view.
- The US economy should grow above trend in 2021, likely more than 4% YoY. This will still leave it almost 10% below its pre-pandemic trajectory by the end of this year and it is likely to continue running below capacity until well into 2022.
- Five categories of spending represent two-thirds of the US core inflation basket and, looking at these specific categories individually, we see little room for persistent inflation above recent levels in any of them. The possible exception is the recreational goods category, where globalisation and technology have contributed to consistent price deflation for the past couple of decades. We see the potential for this to fade, shifting the category from a marginal drag to a marginal support of inflation, but the impact should nevertheless be fairly immaterial.
- Housing, which represents c. 20% of the core inflation basket, has been a persistent support for higher inflation, running at almost twice the level of overall inflation for much of the past two decades. We expect this to continue but, if Americans recover from the scars of the global financial crisis (GFC) related housing bubble and animal spirits* return to the US housing market, this is the one category we think can create an inflation shock which the Fed cannot ignore. We note that this is not our base case.
- We agree with consensus economists’ forecasts that inflation will drift higher over the course of the next couple of years, but we do not believe inflation will be persistently high enough to force the Fed’s hand prematurely.
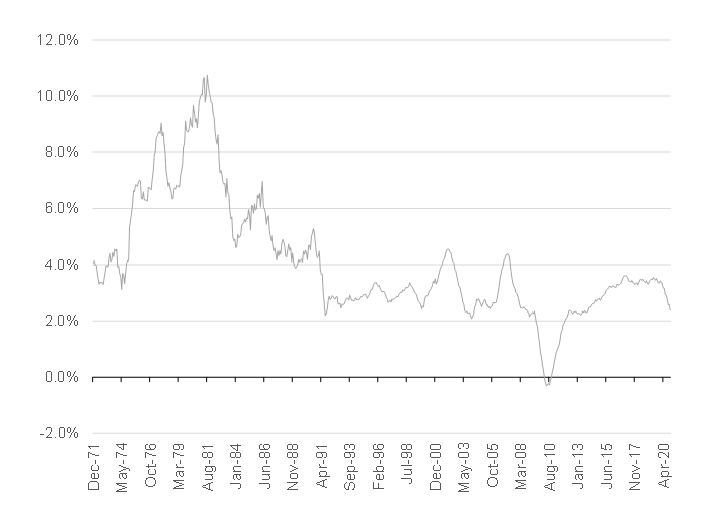
Major central banks have combined with structural trends (slowing developed market [DM] population growth, globalisation, and technological innovation) to all but eradicate DM inflation volatility over the past 50 years or so.
Figure 1: US Inflation (headline CPI inflation and core PCE inflation)
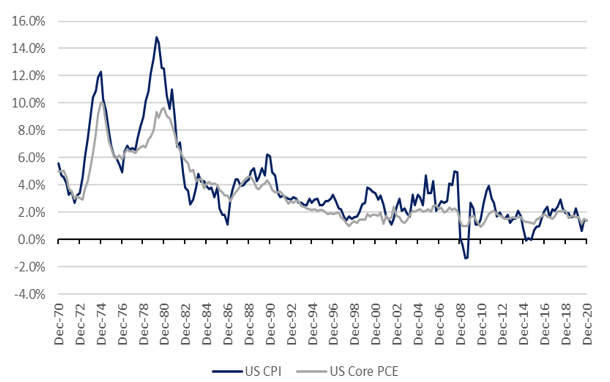
Source: Bloomberg, Anchor
But, with a wall of fiscal and monetary stimulus being thrown at markets to offset the dire economic consequences of the COVID-19 pandemic, many investors are concerned about the potential inflationary impact of disrupted supply chains, combining with excess liquidity, and a faster-than-expected economic recovery. For investors, the return of meaningful inflation is most concerning to the extent that it forces central banks to tighten monetary policy, effectively removing key tailwinds for equity markets which have:
- Increased demand for riskier assets from investors flushed out of cash and bonds in search of any form of reasonable return.
- Made investors more comfortable justifying higher values for companies based on the increased attractiveness of future corporate earnings discounted back into higher present values, using lower discount rates.
What are expectations for inflation?
A recent survey of investment managers by Bank of America (BofA) suggests that there is strong consensus amongst professional investors that inflation is likely to trend higher.
Figure 2: Inflation expectations
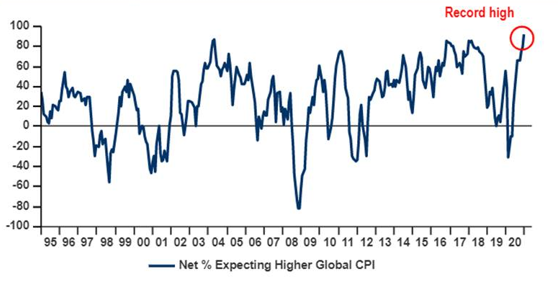
Source: Bank of America Global Fund Manager survey
The key questions for us are not around whether inflation will increase but rather:
- By how much inflation could increase; and
- for how long higher inflation will persist.
To draw any conclusions on this we look at:
- Which forces market commentators have suggested are most likely to impact prices and are these forces likely to be transitory or persistent?
- What are the components of the inflation basket that are likely to have the most material impact on overall inflation?
We focus on US inflation since the US dollar’s status as reserve currency tends to result in US rates having the most significant impact on global funding markets. The US is also a good proxy for what is happening in major DMs and has very granular data to analyse.
Factors that the bears are suggesting will drive inflation higher include:
- Disrupted production causing a supply shock.
The pandemic shut down mining and manufacturing operations around the world, raising concerns that supply bottlenecks could result in inflation. The Bureau for Economic Policy Analysis in the Netherlands publishes an index of global industrial production, which suggested that the first four months of 2020 saw a 12.5% contraction in global industrial production.
Figure 3: Global industrial production has recovered quickly from the initial pandemic shock
Source: CPB Bureau for Economic Analysis, Bloomberg, Anchor
Data available to the end of October 2020 suggest that the recovery in industrial output has been as swift, with output only 2% below pre-pandemic levels six months after it troughed at the end of April 2020.
So, we expect supply disruptions to be transitory and to not cause enough persistent goods inflation to prompt the Fed to act.
- Excess saving causing a demand shock.
The CARES Act, signed into legislation by former US President Donald Trump in March, was a $2.3trn relief package of which roughly half went to households and small businesses.
Figure 4: A visualisation of the CARES Act
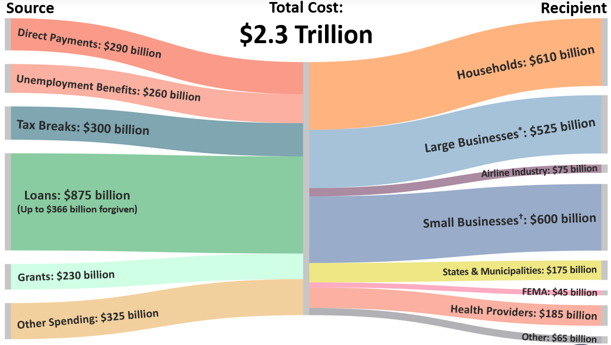
Source: Legislative offices, JCT, bill text, CRFB estimates
*This includes US$170bn of tax cuts for businesses other than corporations, some of which are large companies. ** This includes US$454bn to set up a US$4.5trn Fed facility, which could help support large businesses but also small businesses and state and local governments.
The package included extended unemployment benefits and cheques mailed directly to eligible individuals. The University of Chicago estimated that around two-thirds of unemployed Americans were receiving benefits from the CARES Act that exceeded the compensation they had received when previously employed. The US National Bureau of Economic Research, using household survey data from Nielsen Homescan Panel, estimated that almost 30% of the stimulus was saved by households.
Figure 5: Recipients’ reported use of CARES Act stimulus payments
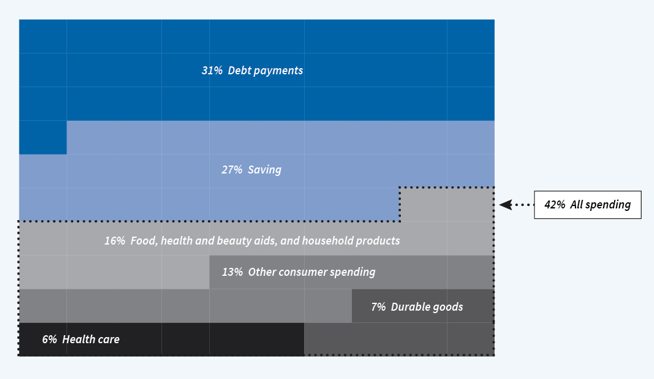
Source: Researchers’ calculations using data from the Nielsen Homescan Panel
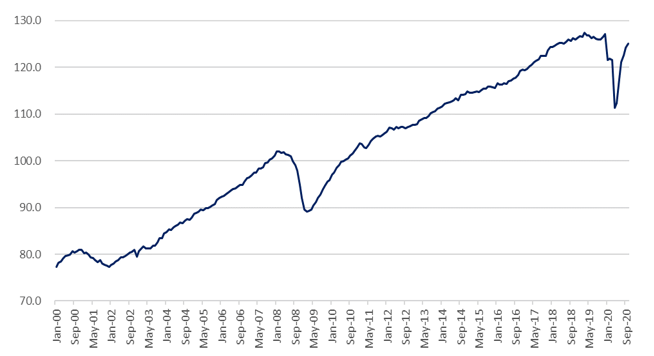
This, along with an inability to spend on some activities that were restricted because of lockdown measures, and a general increase in more conservative consumer behaviour in the face of economic uncertainty, led to a fivefold increase in US personal savings (from $1.2trn to $6.4trn) in the first four months of 2020. This had somewhat subsided by the most recent reading at the end of November 2020, when US personal savings stood at $2.2trn, leaving US households with approximately $1trn of excess savings – the equivalent of about 7% of what American households spent on consumption during 2019.
Figure 6: US households accumulated c. $1trn of excess savings in 2020
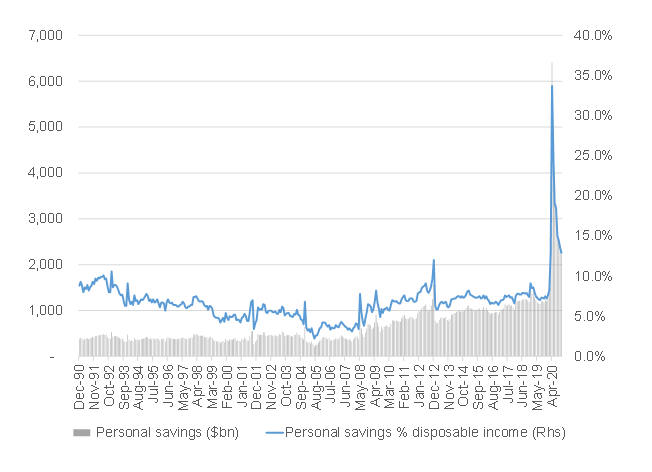
Source: Bloomberg, Anchor
It has been speculated that, as Americans get comfortable that the economy is going to normalise along with the vaccine rollout, these excess savings will fuel consumption and put pressure on prices. While we recognise that this is a distinct possibility, we are reasonably certain that this will be a once-off demand shock, which will fade as soon as savings normalise, and we think that the Fed will be happy to look through this one.
- The US economy is recovering quicker than expected, meaning a sooner-than-expected end to fiscal and monetary stimulus.
Some market commentators believe that the US economic recovery will happen much quicker than expected and will force the Fed to start tightening monetary policy sooner than it would have hoped. We calculate that the projected path of US economic growth should still leave it some 10% behind where economists thought it would get to by the end of 2021, based on pre-pandemic forecasts.
Figure 7: The projected path of US real economic growth, pre-pandemic relative to most recent projections
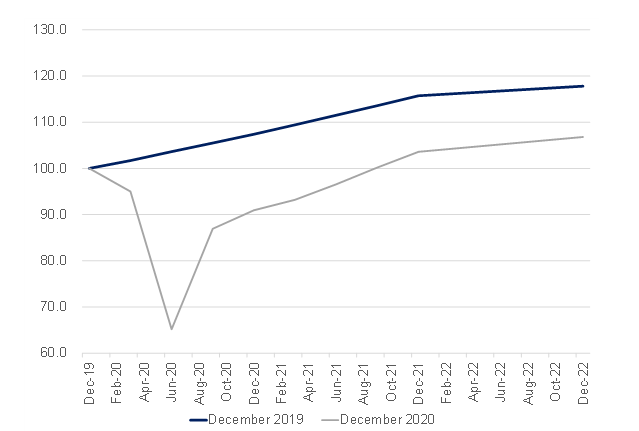
Source: Bloomberg, Anchor
This should still leave the US economy with plenty of slack before it overheats. The IMF currently expects US economic output to be running comfortably below capacity until deep into 2022.
Figure 8: The US economy should have plenty of slack until well into 2022
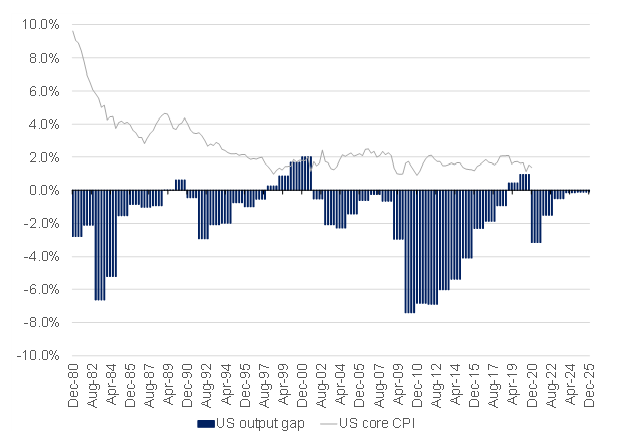
Source: Bloomberg, IMF, Anchor
We think that US fiscal stimulus is likely to be muted going forward, but that is probably already baked into expectations. The Fed has signalled that its unlikely to raise interest rates for the next few years and, with a long runway of sub-optimal output in the US, we do not see any reason to doubt that. Even the most optimistic expectations for US economic growth, leave the economy with still plenty of work to catch up to its pre-pandemic potential.
Which components of the inflation basket can have a material impact on the outcome?
Most of the arguments regarding inflation happen at a reasonably high level, but we find it useful to look at the underlying categories contributing to inflation to assess which components are likely to have the biggest impact on the headline number.
The US Fed focuses on the core PCE deflator, which is essentially measuring the inflation of a basket of goods weighted according to what Americans spend on each year (excluding the volatile food and energy components). The South African (SA) inflation basket (and emerging market [EM] inflation in general) tend to have a much higher component of basic spending on non-core food and energy items than DMs like the US. DM consumers tend to spend a significantly larger portion of their wallet on services, than those in EMs.
Figure 9: DM consumers allocate more spending to services, while basic needs like food and energy require a smaller portion of their wallet
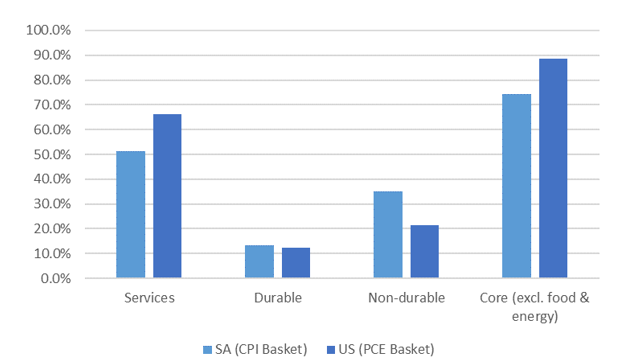
Source: Bloomberg, Anchor
US inflation has a significantly higher weighting in healthcare expenditure.
Figure 10: Americans allocate a much higher portion of spending to healthcare
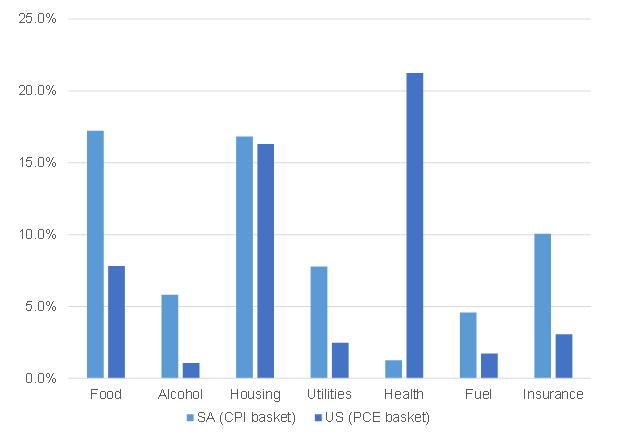
Source: Bloomberg, IMF, Anchor
So, the things that drive DM inflation are reasonably different to those we need to worry will influence domestic inflation. The shift towards higher service consumption in the US over the past 50 years is partially a function of a smaller proportion of a growing wallet going to basic needs such as food and energy.
Figure 11: Shifting US consumption patterns
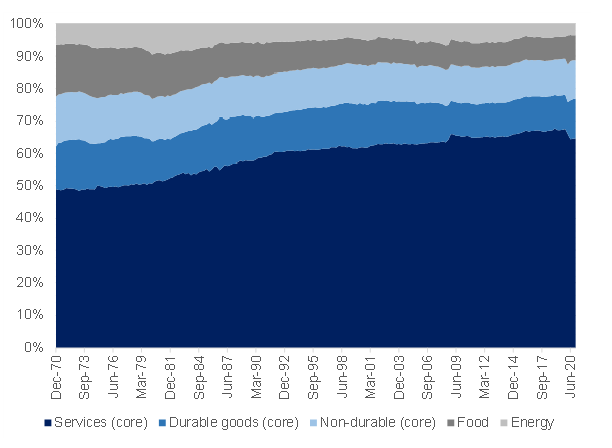
Source: Bloomberg, Anchor
Within services though, Americans have also been growing the share of wallet that they allocated to spending on healthcare and financial services, which now account for a quarter of all spending.
Figure 12: US consumers have significantly increased spending on healthcare and financial services over the past 50 years
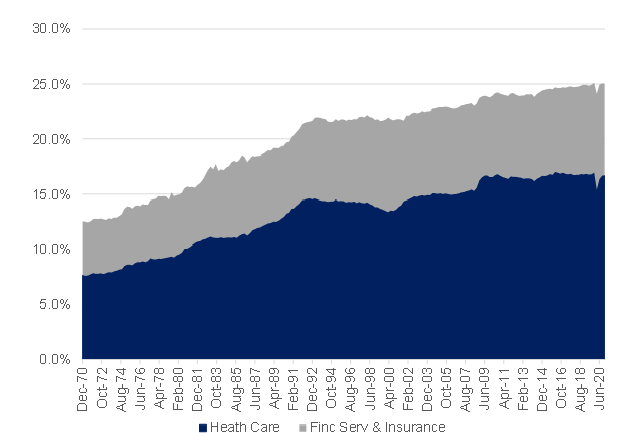
Source: Bloomberg, Anchor
Figure 13: A breakdown of the core US inflation basket with price trends over the past two decades
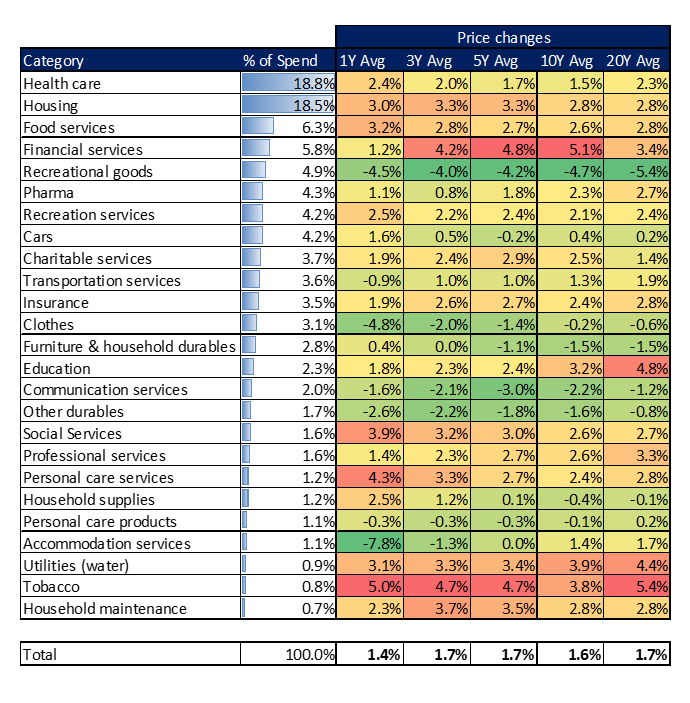
Source: Bloomberg, US Bureau of Economic Analysis, Anchor
We will discuss five categories within the US core inflation basket that represent two-thirds of core US consumer spending in this note: healthcare (including pharma), housing (excluding utilities), financials services (including insurance), food services and recreational goods and services.
Healthcare (including pharma) accounts for almost one-quarter of the core consumer spending basket and more than half of that spend is on hospitals and prescription drugs.
Figure 14: Breakdown of US healthcare spending
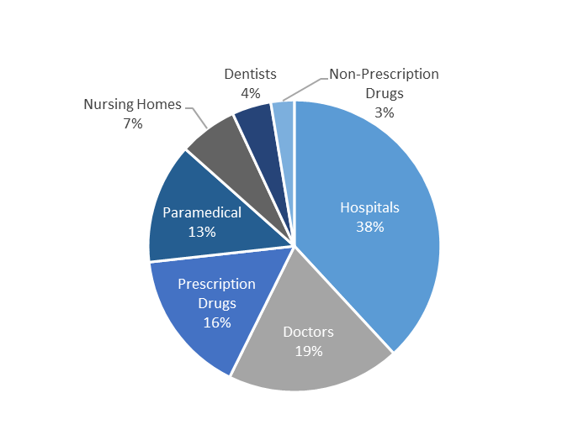
Source: US Bureau of Economic Analysis, Anchor
Inflation has been running at around 1.5% or less for the past 10 years, thought it has crept above 2% in the past few years. It is hard to imagine an environment where a Democratic Party-led government allows the cost of healthcare to increase meaningfully from here over the next few years, while it controls government.
Figure 15: US healthcare inflation
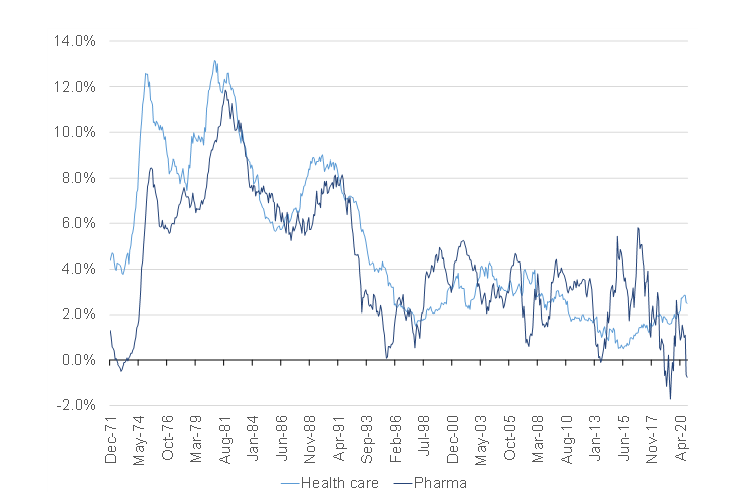
Source: Bloomberg, Anchor
Housing has long been an above-average performer in the US inflation basket, having dropped only briefly below 2% during the GFC. It has been running at around twice the level of overall core PCE inflation for most of the past 20 years, though it has trended moderately lower over the course of the pandemic. We expect housing inflation to continue running comfortably above 2% as consumer balance sheets remain healthy, funding conditions remain decent, and historically low home-ownership rates support demand. Pandemic base-effects may cause a spike in housing inflation during 2021 though, with an already above-average run-rate, we doubt housing inflation can deliver much persistent incremental inflation impetus, particularly with the GFC-related housing bubble still fresh in the minds of many Americans. This category though, seems the one most likely to deliver an inflation shock if animal spirits return to the US housing market and we will be keeping a close eye on how things play out here.
Figure 16: US housing inflation
Source: Bloomberg, Anchor
Financial services inflation is calculated using a significant number of assumptions, with the biggest part of the basket being the implicit “cost” bank clients incur depositing funds in banks (calculated as the income banks earn on placing deposits with the Fed less the interest that gets paid to bank customers) and the “cost” borrowers incur by paying interest to banks that is higher than the funding cost of those loans. Ironically, this theoretical calculation is sensitive to Fed policy changes, so inflation coming though this channel is likely to be ignored by central bankers due to its overly technical characteristics and the feedback loop it has from actual Fed policy.
Figure 17: US financial services and insurance inflation
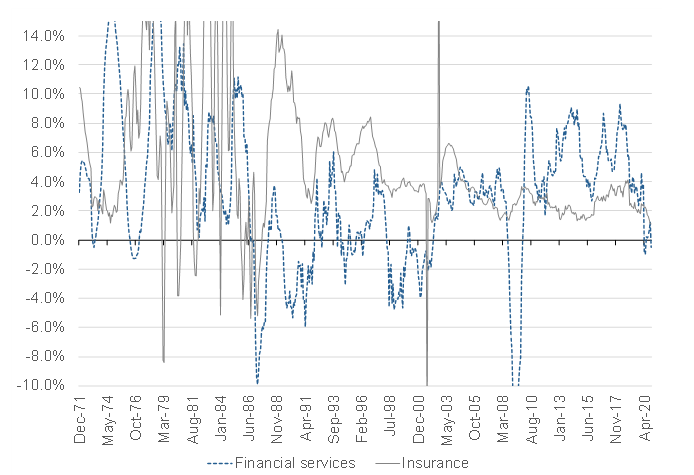
Source: Bloomberg, Anchor
The food services category is roughly evenly split between full-service dining and limited-service dining (which encapsulates fast-food restaurants and take-out). While full-service dining was hit hard by lockdown restrictions, fast-food and take-out services have thrived.
Figure 18: Breakdown of US food services spending
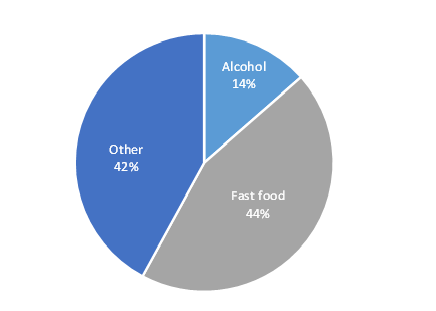
Source: US Bureau of Economic Analysis, Anchor
Full-service dining may experience some transitory inflation spikes of a supply nature as many businesses, which have been forced to shut, face delays in getting back up and running to meet normalising demand. We think any supply lead spikes in inflation in this category (which are already becoming apparent in the past few months) are likely to be transitory in nature as the sector is dominated by small businesses which are likely to be nimble in getting back on their feet.
Fast-food restaurants and, in particular, the food-delivery element, is in the midst of a technology-induced transformation and as the major food-delivery apps and services compete for market share, we expect discounting to keep a lid on inflation. This category is also subject to the impact of food price inflation, though this tends to be transitory and is likely to be ignored by the Fed.
Figure 19: US food services and accommodation inflation
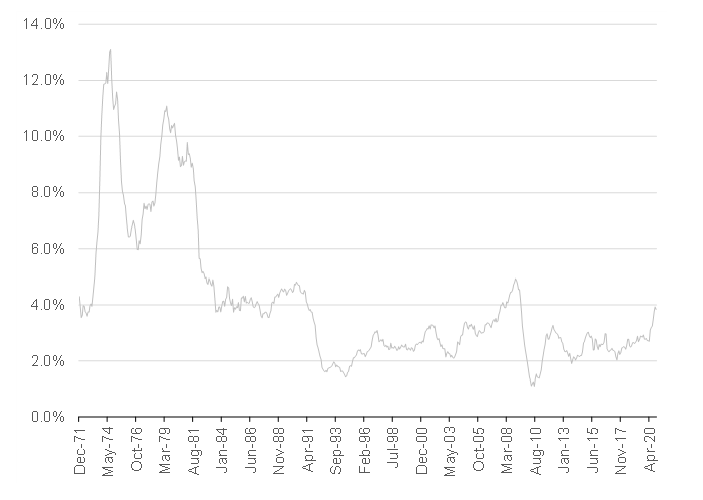
Source: Bloomberg, Anchor
Recreational goods and services account for c. 9% of US core consumer spending and have been experiencing vastly different price dynamics over the past two decades. Recreational goods have experienced significant deflation, while recreational services have experienced above-average inflation.
Figure 20: US recreational goods and services inflation
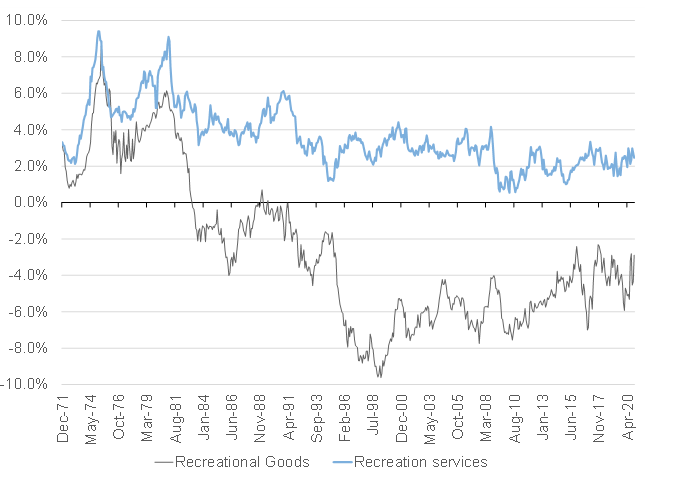
Source: Bloomberg, Anchor
Around 40% of the recreational goods category is the purchase of TVs and personal computers, where pricing has been significantly impacted by globalisation and technological innovation.
Figure 21: Breakdown of US recreational goods spending
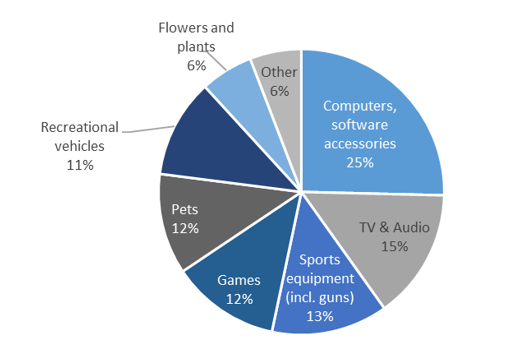
Source: US Bureau of Economic Analysis, Anchor
This category, more than most, could be impacted by a reversal of globalisation and a slowing of technological innovation, but computers and TVs represent only a combined 2% of the core consumer basket. Slowing price deflation is thus unlikely to be particularly material to overall inflation.
Recreational services have experienced above-average inflation for most of the past couple of decades, with TV services making up a quarter of the spending in this category. As streaming services look to displace cable and satellite services, we expect price wars will contribute to deflation in this key category for the foreseeable future. As such, we believe that this category will shift from a marginal support to a marginal drag on inflation for the next couple of years.
Figure 22: A breakdown of US recreational services spending
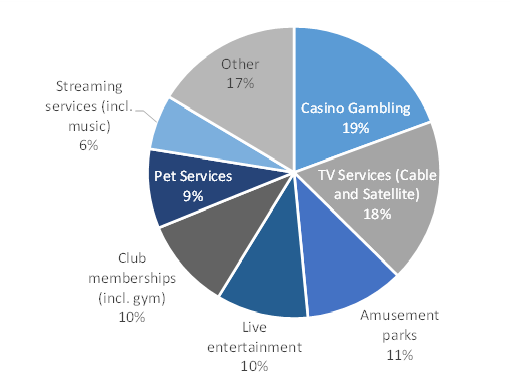
Source: US Bureau of Economic Analysis, Anchor
Conclusion
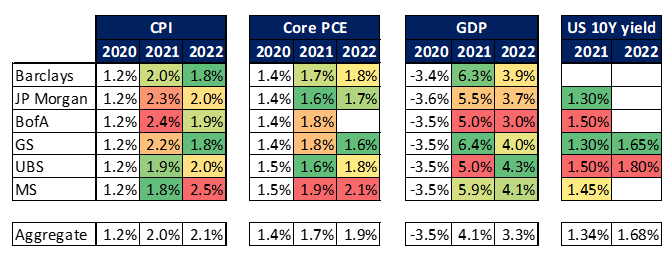
We expect US inflation to creep higher in 2021, although we think much of it will be transitory and even next year, we see core PCE inflation missing the Fed’s 2% target on the low side. Despite higher inflation, we think that for the foreseeable future it will not be high or persistent enough to disrupt the Fed’s easy monetary policy stance to the extent that it would materially derail markets. Most of the major global investment banks’ forecasts tend to be aligned with this thinking. Even the most aggressive core PCE inflation forecast for 2022 of 2.1% (by Morgan Stanley), in our view, falls comfortably inside the Fed’s stated tolerance level of “moderately above 2% for some time”, which suggests that the Fed will not be tempted to tighten monetary policy any time soon.
Figure 23: Major economic forecasts by various global investment banks
*The term “animal spirits” refers to the state of consumers and businesses’ confidence or pessimism and how individuals arrive at financial decisions in times of economic stress or uncertainty. John Maynard Keynes coined the phrase to describe the despondence that led to the Great Depression and the consequent changing psychology that accompanied recovery.