At Anchor, we encourage our analysts and fund managers to motivate their thoughts and challenge consensus thinking. We have been, and continue to be, strong proponents of the tech sector and its extremely attractive long-term growth story. In this article, Henry Biddlecombe argues that, in the shorter term, it might be the turn of “recovery shares” to outperform as the world normalises. This investment view is expressed differently in various mandates across the business, depending on the time horizons and risk mandates. Our core philosophy remains constant – we want to be invested in quality, high-growth businesses, which we can buy at a reasonable price. For certain mandates, a shorter-term tactical shift for a portion of the portfolio may well be appropriate under current circumstances.
We are almost through August – roughly 7 months since the seemingly remote tremor in Wuhan birthed the COVID-19 tsunami that would rip through global equity markets just weeks later. Much like the tragic sequence of events that follows an actual tsunami, the only investors that would escape the carnage were those that immediately ran for the hills. Most of us loitered on the beach, wasting critical moments while our skepticism turned to disbelief as the wave came into view and it became apparent that there was no escape.
And it hit hard. Between 18 February and 23 March, the S&P 500 Index would crash by over 33% – one of the worst falls in modern history. While the more cyclical sectors were hardest hit, there was nowhere to hide as the immeasurable economic consequences of a global lockdown drove indiscriminate selling.
Then, almost as quickly as the wave came – it subsided. Exactly six months later, on 18 August, the S&P 500 officially passed the peak it reached on 18 February 2020 to reach an all-time high. Investors, by and large, find themselves confronted with cognitive dissonance as they struggle to reconcile their experience on the ground with the rapid recovery of their investment portfolios.
Understandably, many of our clients are now finding it difficult to build any level of conviction in equities going forward. We would like to offer a view.
A changed landscape
The S&P 500, covering 80% of available US market capitalisation and with US$11.2trn indexed against it, will always serve as the first, and primary, barometer of risk sentiment. However, to state that the market has now “fully recovered”, while technically correct, would also be to miss a significant tectonic shift in its constitution. A look “under the hood”, so to speak, tells a far more nuanced story.
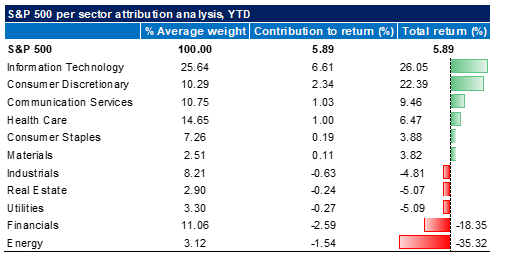
The broader tech sector has explained 174% of the S&P 500’s 5.9% return, YTD. In other words, tech has added 10.23% to the value of the S&P 500. The rest of the market is down YTD, having detracted 4.33% from the S&P 500’s performance.
The divergence between tech shares and the rest of the economy is understandable. Not only have the operations of most tech companies been fairly resilient under lockdown conditions, but many have actually thrived as several secular themes were meaningfully accelerated by the pandemic. Perhaps the best example has been ecommerce penetration in the US, which has increased from 16% to 26% over the past 6 months. To put this in context, it took US ecommerce penetration 10 years to go from 6% to 16% – that is 10 years of progress in only 24 weeks!
The physical economy, however, has fared much worse. Global blue-chip counters (e.g. Nike, McDonalds, Starbucks) saw their revenues plummet in 2Q20, with trading conditions only starting to normalise in July. Some have still not seen a return to past YoY growth. As we move up the cyclical curve, many companies continue to operate at only a fraction of their normal capacity – and their management teams are far more concerned with survival than with growth at the moment.
Given the vastly different dynamics at play within the digital and physical economies, we find it difficult to generalise about the market at this point. Instead, we believe it is important for investors to appreciate the nature of this dichotomy before making any changes to their allocation to equities. In our view, the answer is not to rotate out of the asset class – but rather to rotate within it.
Figure 1: Tech has led the charge, while cyclicals have lagged
Source: Bloomberg, Anchor
Out with the new, in with the old
Opportunities in an equity market are sometimes relative, and sometimes absolute. As we dig deeper into the worst affected “old world” sectors, we are finding an interesting combination of both types.
Sectors which are flat, or only moderately down, may not initially seem like overly compelling relative value opportunities but going one level deeper reveals many individual stocks that, even now, are still down anywhere from 20% to 60% YTD. Of course, there are very good reasons for this – many of these companies have seen revenues halve over the last few months – but their valuations start to look interesting if you are willing to take a view on the broader normalisation of trading conditions over the next year.
Sysco (NYSE: SYY) is a good example. As the US’ largest foods distributor, social distancing measures and the resultant shutdown of the eat-out industry sent the share down over 60% in March. Today, the share is still down 30%, despite more than 60% of US restaurants having reopened – with that statistic trending higher every week. (see Figure 3).
Synchrony Financial (NYSE: SYF), a private label credit card issuer, and the company behind the Amazon Store Card and many other high-profile branded store card products, is still down 30% from its peak earlier this year. Investors are seemingly concerned that high levels of unemployment will mean large-scale defaults on credit card debt, yet the Federal Government’s expanded unemployment insurance programme has kept household income close to pre-crisis levels (see Figure 5).
Ryman Hospitality Group (NYSE: RHP) found itself right in the eye of the storm. As a real estate investment trust (REIT) that owns upscale convention centre resorts and country music halls, revenues fell to zero almost overnight. Given that the company has US$2.6bn in net debt, the market quickly started to price in bankruptcy and sent the share down 85%. Today the share is still down 60% but, as the US economy starts to reopen, this is an instance where prospects could improve dramatically – and the share price will react accordingly.
There are many more examples of market laggards that could potentially outperform the market by a meaningful margin as the economy starts to normalise again, but how long will this take?
Watch the leading indicators
One thing we do know about equity markets, is that they are forward looking. They do not price in the present, but rather a probability-weighted version of the future. Although our lives have not gone back to normal just yet, there are many leading indicators around us that suggest we may go back to normal sooner than the market suggests.
60% of the US population carries an iPhone in their pocket. If one could monitor the movement of this userbase, it would offer an incredible top-level view of US consumer activity. As it happens, Apple has made this data available daily as a service to the public during the pandemic. The trend is clear – US consumers are hitting the streets again.
Figure 2: US iPhone user routing requests since 13 January
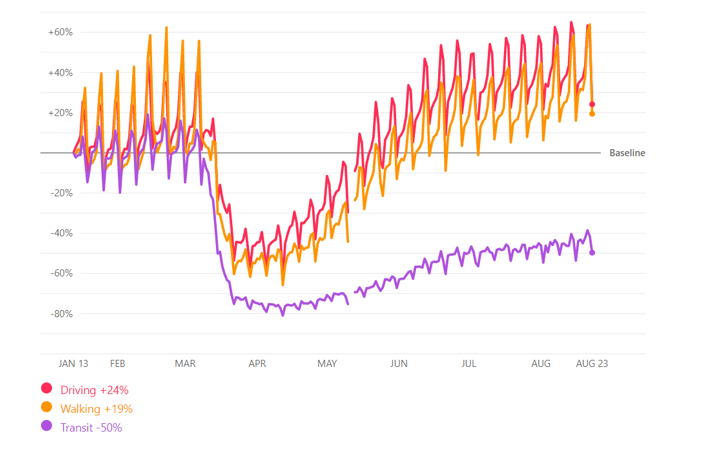
Source: Google Mobility Statistics
Restaurant activity, which we consider to be a harbinger of the “great re-opening”, continues to tick upward. OpenTable, a prolific restaurant reservation app, reports that almost 70% of US restaurants are open and taking reservations.
Figure 3: The percentage of US restaurants open and taking reservations
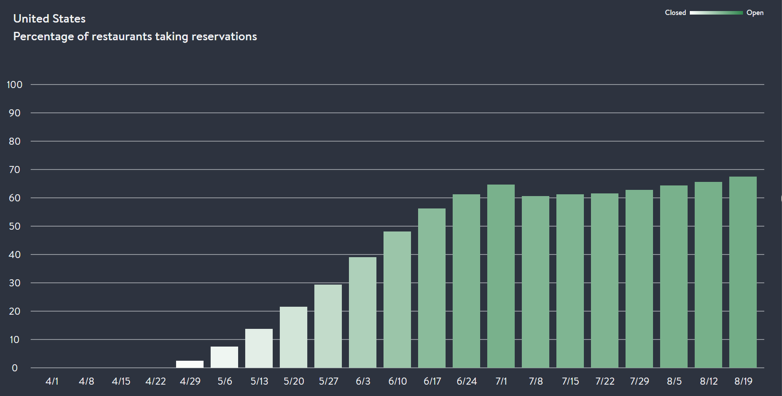
Source: OpenTable COVID-19 industry statistics
As of July, global purchasing manager’s indices (PMIs) are also starting to turn positive. In the US, for example, this survey asks senior decision makers at more than 400 companies, across 19 primary industries, to describe business conditions. A reading above 50 indicates economic expansion, while below 50 indicates contraction – July’s manufacturing PMI came in at 54.2.
Figure 4: Global PMIs turned positive in July
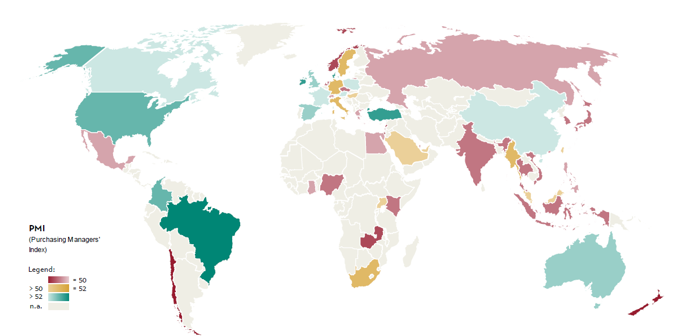
Source: Markit Economics, DataStream, Bloomberg Finance, Julius Baer, Values for Israel and New Zealand: June 2020
Understandably, one might be skeptical of the postulation of a resilient US consumer or an expanding business environment at a time when US unemployment has recently touched the highest level ever (14.7% in April), and after the worst annual GDP contraction in the country’s history (2Q20 GDP fell 32.9% QoQ seasonally adjusted annualised). However, the combined response from the US federal government, and the US Federal Reserve (Fed), have been equally as significant.
An unprecedented level of stimulus
A return to “normal life” would mean little for the US economy if consumers were without disposable income, given that 70% of US GDP is driven by consumption expenditure. To ensure that spending did not collapse when it was needed most, the first round of fiscal stimulus passed by the federal government included the aggressive expansion of unemployment benefits.
In addition to the typical 30% replacement rate (i.e. the unemployed receive 30% of their weekly wage as a benefit), the expanded programme paid an additional post-tax US$600 (!!) per week to claimants. The net effect has been that jobless Americans have been taking home MORE post-tax income than when they were employed!
Figure 5: US wages earned vs actual income (including stimulus) indexed
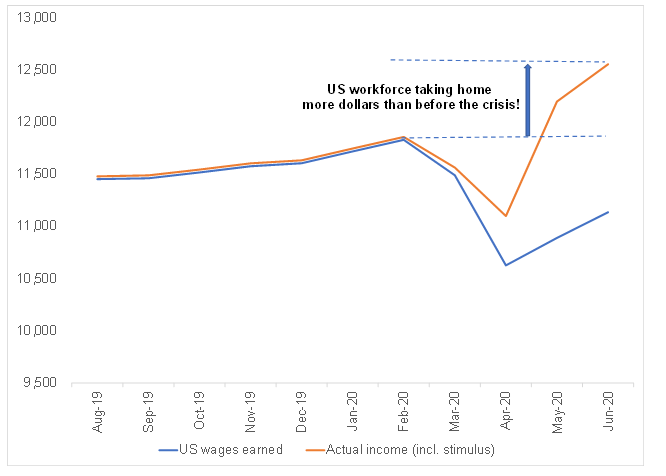
Source: Bloomberg, Anchor
This has not only allowed consumers to continue to spend as though they were gainfully employed, but the support has also prevented large-scale delinquencies (that typically result from economic crises) from appearing on credit reports. This means consumers’ future access to credit has been protected, which bodes well for consumer credit expansion as the economy starts to normalise again.
The efficacy of the remaining fiscal measures, such as the Payroll Protection Program (PPP) loans and the Economic Injury Disaster Loan Program (EIDL), have also dampened the level of permanent job losses and busines failures.
The Fed has also taken unprecedented measures. The combination of a federal funds rate set at between 0%-0.25%, and asset purchases that have injected liquidity indirectly via the banking system, and directly via the corporate bond markets – have protected larger corporates, which have had to endure much lower or even negative cash flows.
All in, as it stands currently, the total value of stimulatory policy in the US is around US$4trn – roughly 25% of the country’s annual GDP. In addition, we also expect a new round of stimulus in the region of US$2trn to be passed on Capitol Hill in the coming months and the Fed’s current pace of asset purchases suggests another US$2trn will be added to its balance sheet. This would bring the total value of the response to US$8trn, or just over 40% of the US’ annual GDP.
To put the significance of this policy response into perspective, it dwarfs the US$800bn in fiscal stimulus and US$3.5trn in asset purchases by the Fed in response to the 2008 global financial crisis (GFC). By our calculations, the economic adrenaline shot this year will be roughly double the size.
Taking a view
So, taking all the above into account, we now end where we started and ask the question: Now what!?
In our view, the early stages of a return to “normal” life are starting to show. Viral cases are subsiding (a statistic we have purposefully omitted from this article given the saturation of coverage), people are on the move again, and an unprecedented level of economic stimulus means that these visible green shoots likely are not false starts.
Just as the market was slow to discount the scale of the pandemic in its first few weeks, it will likely be equally slow to price in the recovery. Intuitively then, this is where the opportunity lies – and the time to act is probably now.
We have mentioned three examples in this article, but there are many stocks that still trade at historically low multiples of normalised earnings/tangible book value as pessimism persists at the cyclical end of the market. A combination of counter-rotation from a frothy tech sector, and continued evidence of a return to normal activity levels, could drive significant absolute returns from these sectors over the coming months.
Anchor has constructed a recovery portfolio, which holds stocks that will likely benefit disproportionately from an economic recovery in the US. For more information, please contact your financial advisor or email sales@anchorcapital.co.za.