ECONOMICS
As we move into the last quarter of 2021, the global economic recovery is still proceeding rapidly, albeit hitting speedbumps along the way. An unprecedented boom in consumer demand for durable goods has stretched the capacity of global suppliers. Supply bottlenecks are curbing the rate of output expansion and creating near-term inflationary pressures. Elevated inflation and an ongoing recovery in the labour market have prompted the FOMC to consider whether the current level of monetary support is still appropriate. At the September Fed meeting, Fed Chair Jerome Powell provided some heavy hints that we may see a tapering announcement at the November meeting, with quantitative easing (QE) purchases ceasing in mid-2022. However, there are still some key factors that could hold back the US outlook. In particular, growth is likely to have slowed in 3Q21 as the spread of the Delta variant over the summer months, and the impact of Hurricane Ida, weighed on US economic activity.
Meanwhile, supply chain disruptions and labour shortages are set to remain a concern for the rest of the year. The euro area economy appears to have put in a strong 3Q21 GDP performance, despite the moderation of some recent indicators, leaving it on-track to erase the pandemic-triggered drop by the end of this year. This looks to be one yardstick by which the ECB will judge whether the crisis phase of the pandemic is over and feed into policy considerations looking forward. Progress with the vaccine rollout is limiting the impact of renewed increases in COVID-19 cases on economic activity in Europe and the US. But virus dynamics are influencing growth more heavily where vaccination rates remain lower. The pandemic is still constraining labour supply.
Further complicating the global economy is the flurry of regulation and uncertainty stemming from China as Chinese authorities attempt to realign the private sector with China’s social development objectives. This is consequently hampering economic growth, and naturally worrying investors and financial markets alike. We have seen contagion spread to most EMs and a sense of risk-off has been created. This, in turn, is strengthening the US dollar and weakening EM currencies. When China sneezes, EMs catch a cold. Furthermore, deleveraging dynamics in the property sector are weighing on China’s recovery. Macro policy is starting to be recalibrated, but slower housing activity will take a toll on domestic demand and global commodity markets. Challenges to the EM growth outlook for 2022 are starting to build.
Locally, SA has recorded better-than-expected GDP growth for yet another quarter, with GDP expanding 1.2% in 2Q21. However, the local economy is still lagging its peers — and economic recovery has not been robust enough to mitigate a record-high unemployment rate of 34.4%. Nonetheless, SA’s economic prospects are steadily improving, thanks to a better-than-expected financial performance in 2Q21. A robust economic performance and stronger-than-expected fiscal revenue in recent months mean that SA’s budget deficit in the fiscal year ending March 2022 (FY21/FY22) will be smaller than the government’s projections in February 2021. Notably, revenue from mining, which has been strong in recent months, will slow as the commodity price environment becomes less supportive. However, CG (corporate gains) tax revenue growth looks set to substantially exceed the 12.6% projected for FY21/FY22 in the budget. Nonetheless, crucial social and political issues remain. The more significant issues revolve around the ANC-led government – specifically, how it is dealing with the wage bill, state-run companies, and the pressures it may face at the polls in the coming elections. Time will tell how these local issues will play out, and what it will mean for the greater SA economy.
SA EQUITIES
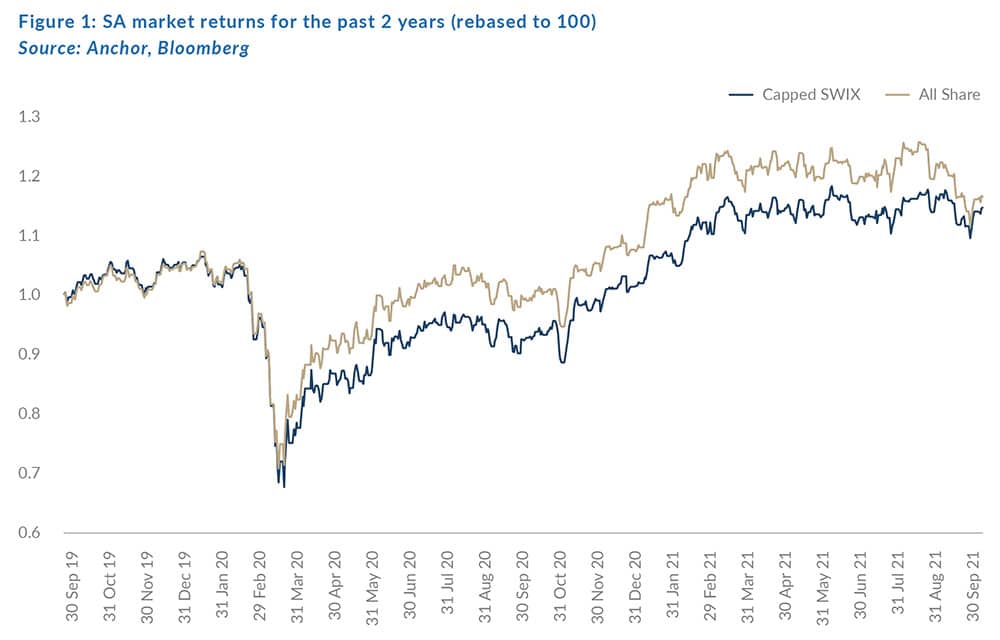
We expect a moderate return (c. 11.8%) from the JSE over the next year. The 16.9% return for the JSE Capped Swix Index over the past 12 months was above expectations, as local economic conditions and company results were better than expected.
After a very strong 1Q21, the SA market has been moving sideways for two quarters as the positive performances of local businesses have been negated by negative returns from resource companies and index heavyweights, Naspers and Prosus.
For most local businesses, operating conditions are now at similar levels to pre-COVID and the country has emerged reasonably intact from the depths of the pandemic, albeit with higher levels of unemployment and well documented structural growth issues. Looking forward to 2022 and 2023, local GDP growth is likely to level out in the region of 1.5%-2%. This is too low to address SA’s challenges, but it should be enough for industrial SA to eke out moderate earnings growth. Stock-picking is likely to be key to earning double-digit returns.
The banking sector provides a meaningful picture of economic growth and in recent results the headline numbers were impressive, but these were largely driven by a continuation of the unwind of hefty provisions created during the depths of the pandemic. Underlying growth was minimal, and this sector will battle to deliver earnings growth in the high single-digits over coming years. However, valuations are low (the banks’ [excluding Capitec] forward P/E ranges from 6x-10x) and dividend yields (c. 5%) are high.
Our selections in the financial sector include Transaction Capital (a fantastic management team and a strong return and growth profile), Quilter (strong structural trends in the UK) and Investec (a self-help story with the core banking business trading at a 6.3x P/E multiple).
At roughly one-third of our total market, the materials sector is very important. The commodity cycle has turned, with iron ore correcting sharply (from US$220/t to the current c. US$120/t) as China stutters while trying to resolve the woes created by property developer, Evergrande. The easy money has been made in this sector and we are entering the phase of reaping dividends rather than expecting outsized returns.
The platinum sector, which is now a hefty 8% of our market, has been under immense pressure, but offers potential on a 12-month view. Underlying global demand for vehicles (the major user of platinum group metals [PGMs]) is strong, but chip shortages have curtailed production and there are vastly different views on when this will be resolved. A reasonable expectation of things starting to improve in the next 3-6 months could well see PGM prices bounce once again.
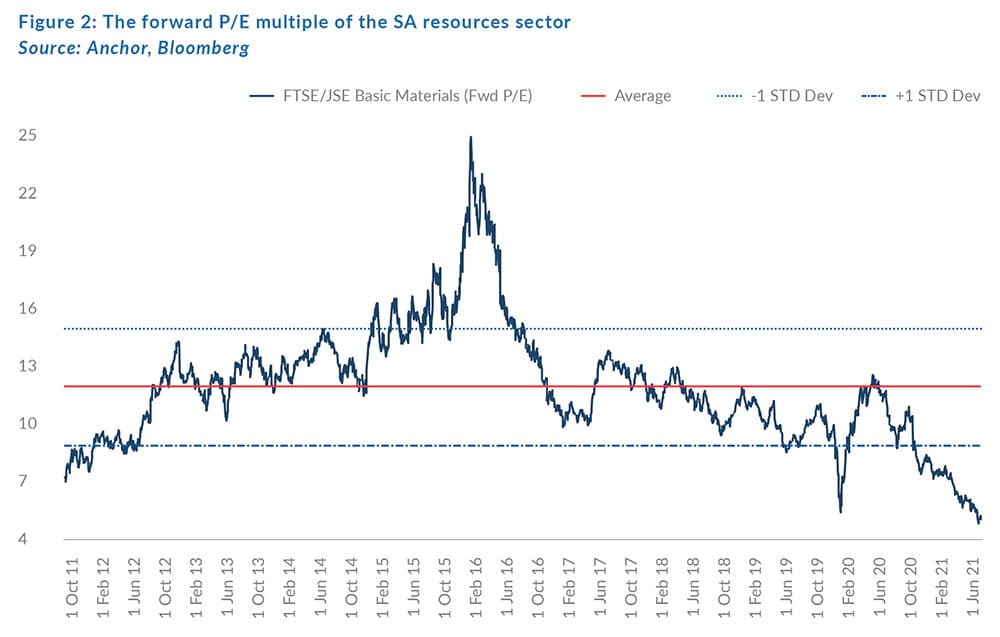
Figure 2 below shows the forward P/E multiple of the JSE Basic Material sector. It is now the cheapest it has been in the past 10 years at 5.3x.
The Naspers/Prosus duo is the biggest share on the SA market and, after being two of the worst-performing shares this year, we believe the 12-month share price outlook is much more positive. Sentiment is hugely against Naspers at present. However, operationally, it is doing very well currently – the last results showed the non-Tencent operations comfortably outgrowing Tencent, and we expect this to continue over the medium term
If you were to imagine the ideal set-up you would want to be in place when making an investment in Naspers/Prosus, it would be (1) the discount to NAV at an extreme; (2) Tencent relatively cheap, and (3) the rand at reasonably strong levels. This is the case right now. It would be naïve to think you would get all these things together without good reason. The recent performance of Naspers/Prosus, controversy around its recent share exchange, and the seemingly endless regulatory upheavals facing Chinese tech this year, currently make investing in Naspers/Prosus feel like a stomach-wrenching contrarian call. However, we think that these issues will pass, and we will look back at this as having been an excellent entry point to invest.
On balance, there are many components of the SA market that now look very cheap, but some for good reason. Within this bigger picture, there are distinct opportunities in the SA market which have company-specific drivers (e.g., Aspen, MTN, and Bidcorp). Construction is also a sector where bulging order books should convert to strong earnings and share prices.
SA LISTED PROPERTY
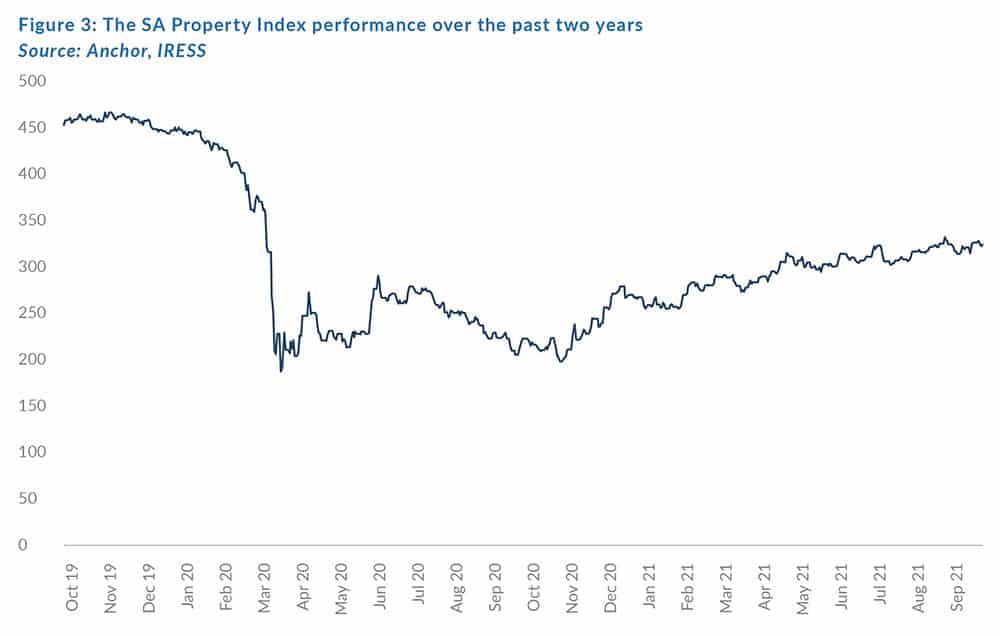
SA listed property is the best-performing SA asset class this year, with a YTD return of 26.4%. After halving in value during the March 2020 COVID-19 crash, the sector has nearly doubled from the bottom, leaving the total return about 20% down from the beginning of 2020.
The bigger SA property companies are trading at dividend yields of 8%-10% and still have some recovery growth prospects as consumer behaviour normalises and tourists return to SA (in the case of Growthpoint, with its V&A Waterfront property). With some potential for capital growth, a 9%-11% total return looks feasible over the next 12 months. However, the long-term growth potential of the sector is challenged given pressure on costs, low economic growth, and the expectation of continued negative reversions for some years to come. Many leases are at above-market levels and when leases expire, if tenants renew, it is typically at rental rates that are around 15% lower than existing rentals. The resultant indicative equation for companies is 75% of rentals going up by 6% and 25% of rentals going down by 15%. The result is flattish earnings, before the negative impact of costs and vacancies which is, in some cases, offset by new developments and other corporate actions.
Balance sheet and loan-to-value (LTV) levels were the big concern when the sector went into freefall last year, but most companies have done great work to repair their balance sheets and all the big property companies have already reduced gearing below loan covenants or have a realistic plan to do so. Property valuations remain a subject of debate and this can obviously impact the equation. In general, companies have surprised the market in disposals over the past year, with many of these at levels close to book value.
However, the SA property market is far from homogenous, and investors can have very different exposures within the property sector:
- The global component of the market looks relatively attractive, with a company like Nepi Rockcastle, for example, trading at a 7% forward dividend yield in euro terms with a 5% compound growth potential as a prospect. Trading is at pre-COVID-19 levels already. Hammerson is trading at half of book net asset value (NAV) and appears to have further recovery potential, especially once the UK government’s moratorium on evictions is lifted. This has resulted in rental collections of around 70%, compared to the above 95% being achieved in Central Europe.
- The SA office sector is very challenged, with vacancy rates of over 25% in some companies. Permanently lower office demand will be a drag for many years to come.
- SA retail is recovering slowly, with footfall around 10%-15% lower than pre-pandemic levels, but in many cases, turnovers are close to pre-COVID-19 levels. Lease reversions are still running at high levels – Hyprop recently announced its latest negative reversions at -23.6%. Community shopping centres have been the star performers, with above-COVID-19 levels being reached, and rentals being maintained and escalating as per normal. This is being experienced by Arrowhead, Fairvest, Resilient and Vukile.
- SA logistics and industrial property is fairly client and company specific, but building prices are about the same as five years ago and hence, when longer-term leases get renewed, negative reversions can be meaty.
One of the big drivers of the SA listed property market over the past decade was capital raising at premiums to NAVs. This saw enormous growth in the share prices of companies that were able to achieve this. This was followed by a devaluation of a basket of these companies a few years ago. It is interesting to note that there was big demand for Lighthouse’s recent capital raise, with R2.6bn raised. The market clearly has an appetite to entrust certain management teams with capital to take advantage of the dislocations in the property market created in the past two years. We will watch these developments with interest.
DOMESTIC BONDS
SA government bonds weakened into the end of 3Q21, with the belly (R2030) moving from 8.8% to 9.2% and long-end bonds (R2044) moving from 10.55% to 10.84%, both weakening as the front-end firmed up from end 2Q21 (when the R2023 moved from 5.25% to 5.14%). Most of this weakness occurred in the final two weeks of September as central bank announcements and developments in China weighed heavily on EM bonds.
Last quarter we highlighted the risks going forward of central bank actions, and currently the Fed is purchasing assets at a pace of c. US$120bn/month and the US central bank rate is set at 0%-0.25%. However, this pace of bond buying is unsustainable, and the Fed has indicated that it will begin to taper its purchasing programme as we head into 2022. Central bank actions over the next 12-24 months are likely to raise the cost of capital globally.
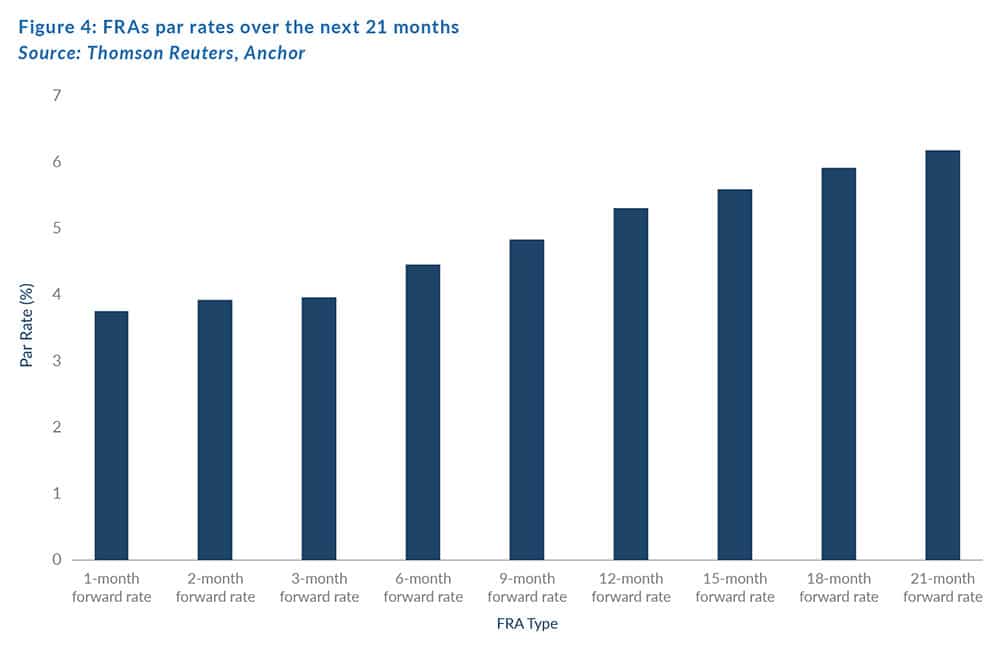
Locally, the SARB’s MPC has maintained rates at 3.5% (a record-low). However, the fixed income derivatives market has begun to more aggressively price in rate hikes going forward. At present forward rate agreements (FRAs or agreements over future JIBAR rates) are pricing in a strong (80%) probability of a 25-bpt SA rate hike by year-end, and a total of 200-plus bpts worth of hikes over the next 18 months.
Domestic news from China has also driven an EM sell-off, with commodity producing countries being hit by expected lower demand on the back of the implosion of Chinese property developer, Evergrande. These factors (US tapering, Chinese domestic developments, and inflation fears) have led to the weakness visible in SA government bonds (SAGBs) over the past 3 months.
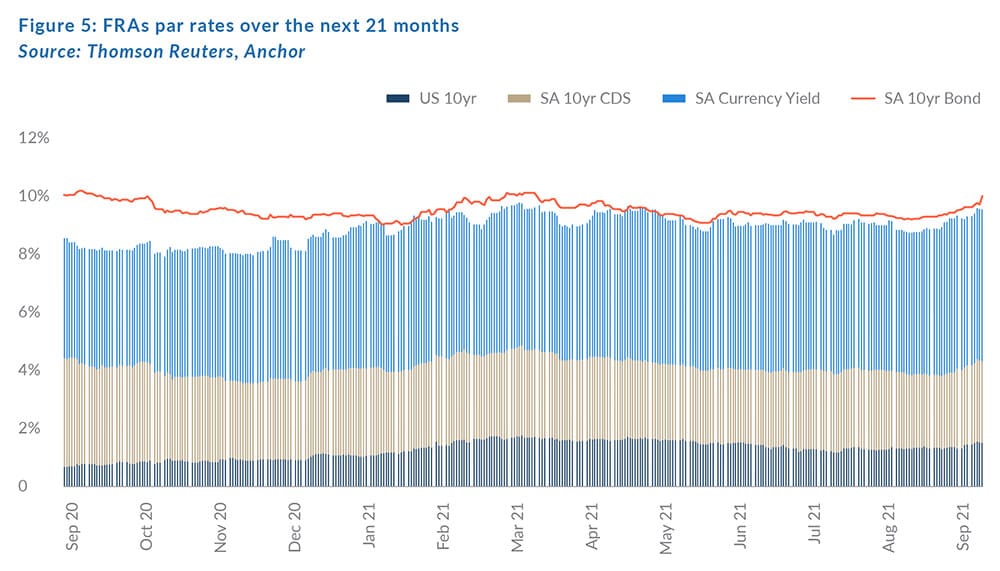
In Figure 5 above, we build-up the SAGB 10-year generic yield, which has weakened by 66 bpts over the past quarter.
YTD, the All-Bond Index (ALBI) has returned 5.38%, with 3Q21 returning 0.37%. The index at present yields 9.4% which is above our long-term fair yield. We view bonds as having some upside from their current yields, giving a net expected return of 9.7% for the next twelve months.
THE RAND
Strong exports of both commodities and manufactured items such as motor vehicles have kept SA’s trade balance strong. The terms of trade are, however, deteriorating with oil prices pushing higher, iron ore prices halving and the PGMs also seeing price declines. We expect that the trade balance will only be slightly positive headed into 4Q21.
Towards the end of 3Q21, the US Fed confirmed that it will begin to tighten liquidity conditions later this year by tapering its bond buying programme. This will likely also have a negative effect on the rand.
A risk-off sentiment towards EMs into the end of 3Q21 has seen the local currency weakening to R15.08/US$1. While the above factors will likely prove to be negative for the rand, the US dollar is also expected to lose some ground in the coming year as the US economy slows drastically.
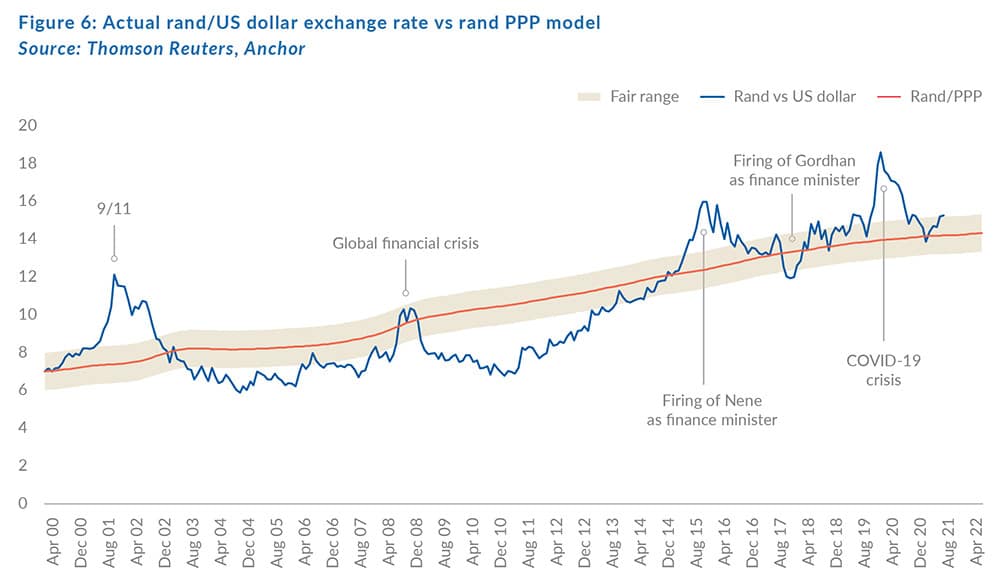
Projecting the rand’s value in a year’s time is a fool’s errand. The rand vs US dollar exchange rate is one of the world’s most volatile currency pairs and trades well away from any modelled fair value for long periods. We note, however, that the rand trades within a R2.50 range to the US dollar in most 12-month periods.
We retain our purchasing power parity (PPP) based model for estimating the fair value of the rand and we have extended this out by three months since the publication of The Navigator – Anchor’s Strategy and Asset Allocation, 3Q21 report on 9 July 2021.
US inflation has been higher than SA inflation for the last few months and this has the effect of pushing our modelled value of the rand stronger. Our PPP-modelled value for the rand vs US dollar at the end of the next 12 months is R14.21/US$1 (see Figure 6). We apply a R2.00 range around this to get to a fair-value range of between R13.21/US$1 and R15.21/US$1.
We expect the rand to remain particularly volatile even though we do think that it will most likely trade in a sideways range for a while.
GLOBAL EQUITIES
Contrary to the dire expectations during the depths of the COVID-19-driven March 2020 market crash, 2020 and 2021 have been great years to be invested in global markets, with a return of close to 30% from the beginning of last year. Our consistent view for the past 12 months has been that we are in a bull market and for investors to keep their full equity allocations.
However, we have also continually cautioned that valuations are very high and share prices are reflecting rosy futures and perhaps not pricing in the risks of a bumpy ride along the way. We started reducing our future return expectations over the past six months and we remain of the view that the next 12 months will deliver lower-than-average returns (5.1%), with the potential for some corrections along the way. The last quarter (3Q21) in global equities was broadly flat. Our longer-term view is that global equities remain the best asset class as solid GDP growth and technology-driven innovation will result in higher margins and above-average US earnings growth.
We saw the first signs of the above in September as a combination of factors conspired to put pressure on the market including: 1) the timeline for higher interest rates in the US moved closer; 2) global supply chain issues and labour shortages curtailed the ability of companies to deliver into strong underlying demand; and 3) China stuttered as Evergrande, its second-largest property developer, showed financial strain and is clearly in a worrying liquidity crisis. These factors will dampen shorter-term earnings growth, impact confidence, and potentially decrease the valuation of longer-duration assets (the current value of future cash flows is lower if interest/discount rates are higher).
At high market valuations the market tends to more sensitive to disappointments and we are at the stage where the market is assessing how transitory the big moves in inflation are. A common theme in company earnings reports is input price pressure across the board. Despite the small correction in September, the market is still backing the strong underlying growth trends. Figure 7 below shows how the earnings recovery has almost run its course and, in 2022 and beyond, we will revert to more normalised, but still very strong, earnings growth.
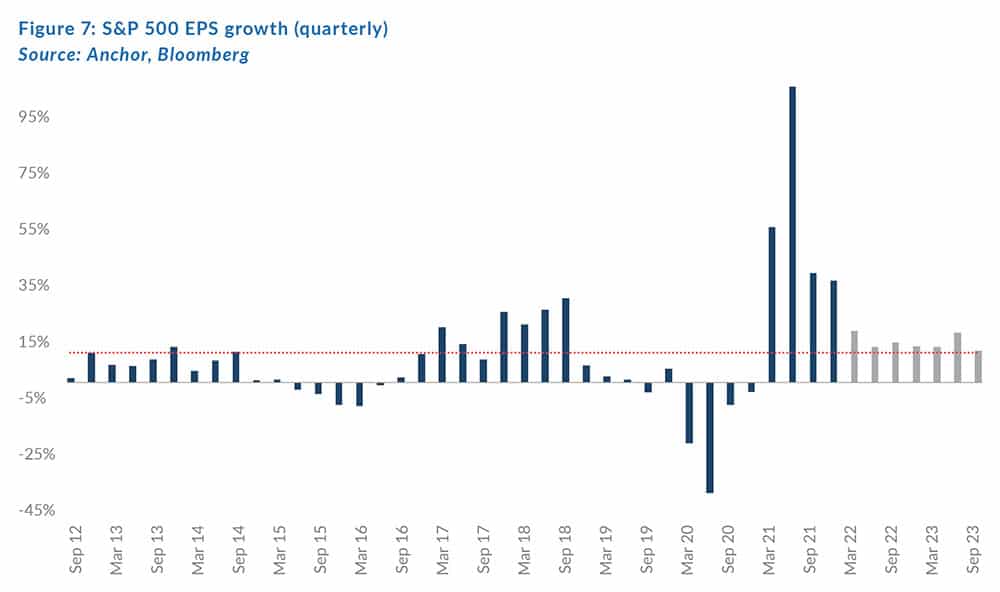
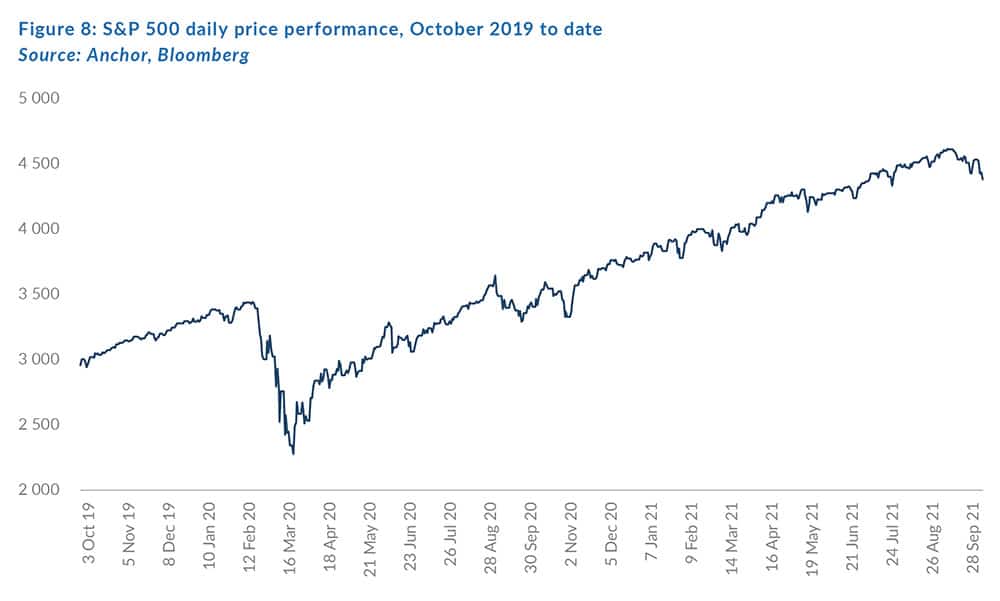
Unprecedented stimulus measures have seen global earnings growth in 2021 materially exceed both expectations and 2019 earnings (by over 20%!). This has resulted in strong stock market performances as shown in Figure 8 below.
The strong market has seen valuations at their highest level in 15 years, as seen in Figure 9 below of the MSCI World forward P/E multiple. Recent sideways share prices and strong earnings growth has seen the market multiple decline over the last few months.
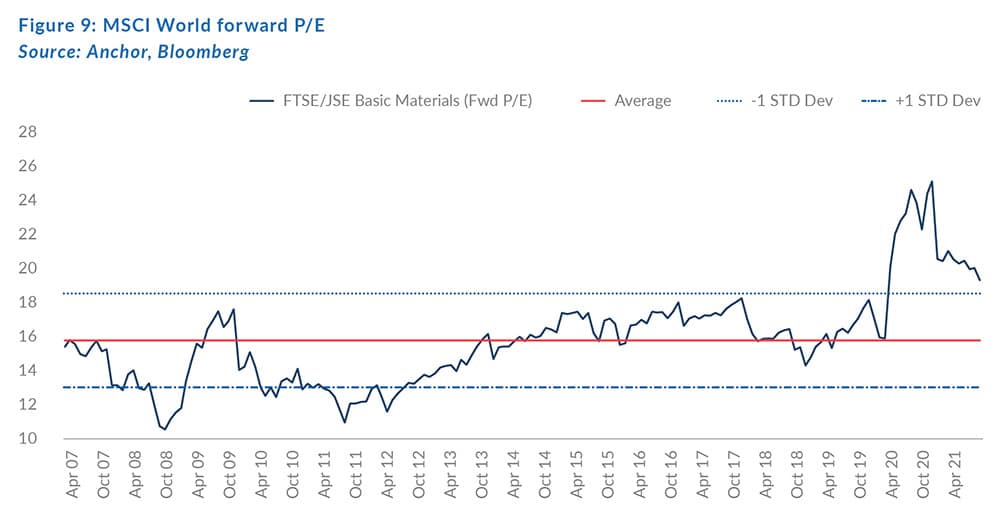
This is also shown in the table in Figure 10 below, with a MSCI World forward P/E multiple of 18.7x. Sustainable low interest rates and strong earnings growth justifies an above-average valuation, with the question being “by how much?”.
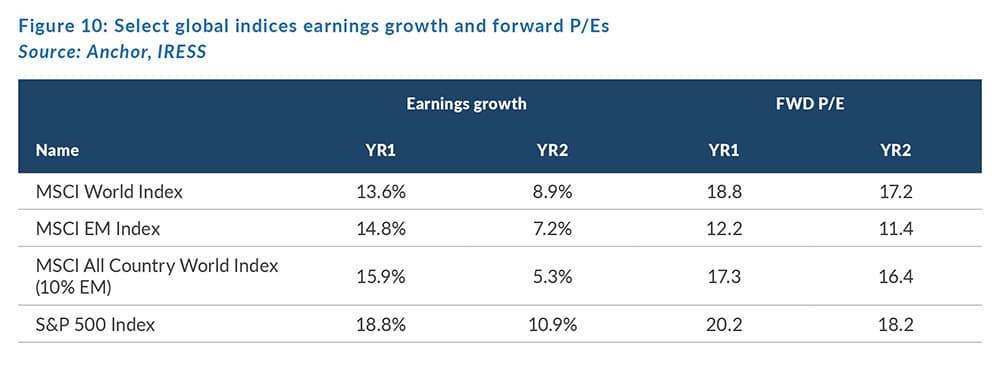
EMs have been perennial underperformers, but the forward 11x P/E multiple looks enticing. EM indices are full of commodity counters, and our approach to capturing the apparent potential in this space is to invest on a very stock-specific basis, where we concentrate on those companies which are benefiting from growing GDP growth per capita and technology adoption which is in many cases faster than the developed world. We are extremely excited about some of our investments in this space.
Macro and valuation concerns mask the opportunity set we see in global equities. We can construct equity portfolios with high-quality, compounding companies that we are excited to own for the next three to five years at reasonable valuations. The market has been on a one-way uptrend for over a year and some volatility will present opportunities to buy great companies at good prices.
No investment perspective would be complete without some mention of the architect of the recent chaos – COVID-19. The market is undoubtedly pricing in a return to normality. This is obviously a risk as the virus has shown the ability to confound the predictions of experts. However, for now, the vaccines’ apparent ability to significantly reduce the risk of hospitalisation and death has seen governments implement plans to live with the virus and open-up economies. Any material change in these plans will present a further risk.
GLOBAL BONDS
Global bonds remain in focus as the market’s comfort with above average equity valuations is largely based on the premise that discount rates used to value assets should be much lower in the “new normal” of perpetually low US dollar funding rates. US dollar rates, the cornerstone of most asset pricing models, have given investors the license to keep owning risk assets despite uncomfortably high valuations and the question on most people’s minds is “how long can rates stay this low?”.
Two somewhat inter-linked themes seemingly hold the key to that question:
- Is the current spike in inflation transitory?
- How much impact does the US Fed QE programme have in keeping funding rates suppressed?
We have written fairly extensively on the topic of US inflation and we remain firmly in the camp that believes the current bout of inflation is largely transitory. This is a function of the low base caused by prices being slashed to stimulate demand around the start of the pandemic, and the current supply chain disruptions (constraining the supply of goods) being transitory. We are though coming around to the idea that “transitory” might in fact drag on for a little longer than hoped, due to the stop-start nature of the pandemic as new COVID-19 strains emerge.
However, we believe that the central banks are unlikely to be tempted to respond to the transitory inflation, even if it sticks around for a little longer than is comfortable. What is becoming more apparent, particularly in the US, where inflation pressures are the most apparent, is that the ability of the Fed to err on the side of caution is becoming increasingly challenging. Economists at the Fed will understand that once there is a broad-based belief that inflation is here to stay, it becomes a self-fulfilling prophecy and, at that point, the consequences of the Fed being behind the curve start to have fairly dire consequences for economic activity.
That leads us into the second question around the importance of QE in maintaining rates at these levels. Here we believe the strongest argument against another 2013 style “taper tantrum” (which caused a 1%-plus spike in US 10-year government bond yields) is that although the Fed is purchasing significantly more bonds than it did in 2013 (currently $120bn/month vs $90bn/month in 2013), it is currently only buying c. 6% of government bond issuances, relative to the 15% of issuances it was taking up in 2013.
Fed chair, Jerome Powell, gave reasonably clear guidance on the path of monetary policy at the most recent Fed meeting in September, indicating that the FOMC members were largely aligned on the fact that the economy is no longer in need of emergency support in the form of QE. In the absence of any nasty surprises, the Fed would therefore start shrinking the quantum of bond purchases from November this year, with the goal of no longer adding to the size of its balance sheet after mid-2022. By that stage the Fed balance sheet would be around US$9trn, having more than doubled in the two years since the pandemic kicked off. US 10-year bond yields spiked about 0.2% in response to this message, though at 1.5% they remain comfortably below inflation and extremely supportive of asset valuations.
The other somewhat hawkish signal from the Fed was the release of adjusted economic forecasts from FOMC members. These forecasts suggests that the members are now more aligned with financial market estimates, that they need to kick off the next hiking cycle with a single rate hike towards the end of 2022.
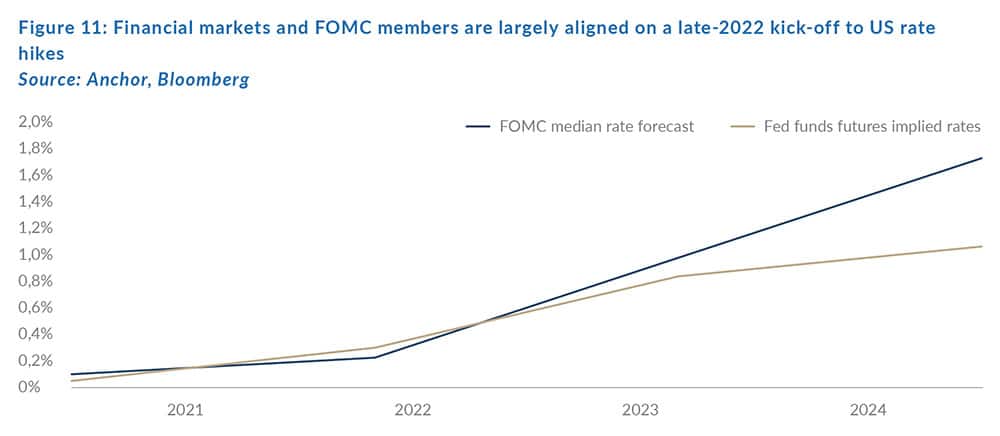
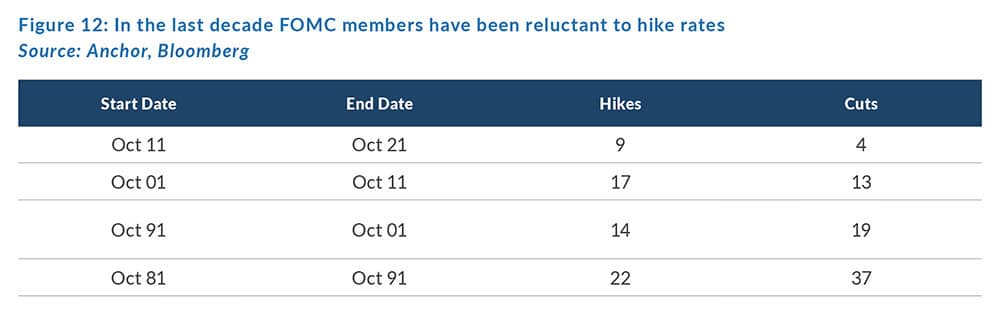
Both financial markets and the average FOMC member then see the pace of hikes accelerate slightly in 2023, with another 2 to 3 hikes (of 0.25%) over the course of 8 meetings. However, it seems that short-term interest rates are expected to remain well below the Fed’s inflation target for at least another couple of years. This perpetuates a theme we have seen since the global financial crisis (GFC) of central banks being very reluctant to hike rates. In over 100 FOMC meetings since December 2008, when the Fed slashed its target rate to 0%, we have seen only 9 interest rate hikes (all of which happened in the 3 years from December 2015 to December 2018). During the Fed’s last hiking cycle, it is also worth noting that the US Fed was the only major central bank hiking rates and, although it is easy to imagine that the pandemic kicked off the latest bout of rate cuts, the Fed was in fact cutting rates well before the pandemic kicked in, having started cutting rates in mid-2019.
So, while its clear that the days of maximum monetary support are behind us, it is hard to imagine the Fed being too aggressive with tightening and if recent history is anything to go by, the tightening is likely to swiftly reverse course at the first signs of major financial market stress.
Our twelve-month forecast horizon takes us to a place where the Fed is no longer expanding its balance sheet and the first rate hike is upon us. We find it difficult to imagine the US 10-year bond yields still being meaningfully below the Fed’s 2% inflation target at that point, particularly given the fact that lingering supply chain impacts are likely to see US inflation still in a “transitory” period of above target levels. Our models lead us to a rate of 1.9% one-year out and that means US 10-year bond investors can expect a negative total return of -2% over the next 12-months.
US investment-grade corporate credit spreads are slightly off their recent lows, but at 0.85% remain comfortably around the most expensive that they have ever been and so, even with a tailwind of economic momentum, it is hard to imagine much upside in credit spreads from here. Our base case is that credit spreads hover around these levels for the next twelve months and that should leave investors in that asset class also suffering a negative total return over the period of -1.2% as rates creep higher.
GLOBAL PROPERTY
DM-listed real estate opportunities are overwhelmingly skewed towards real estate investment trusts (REITs) listed in the US.
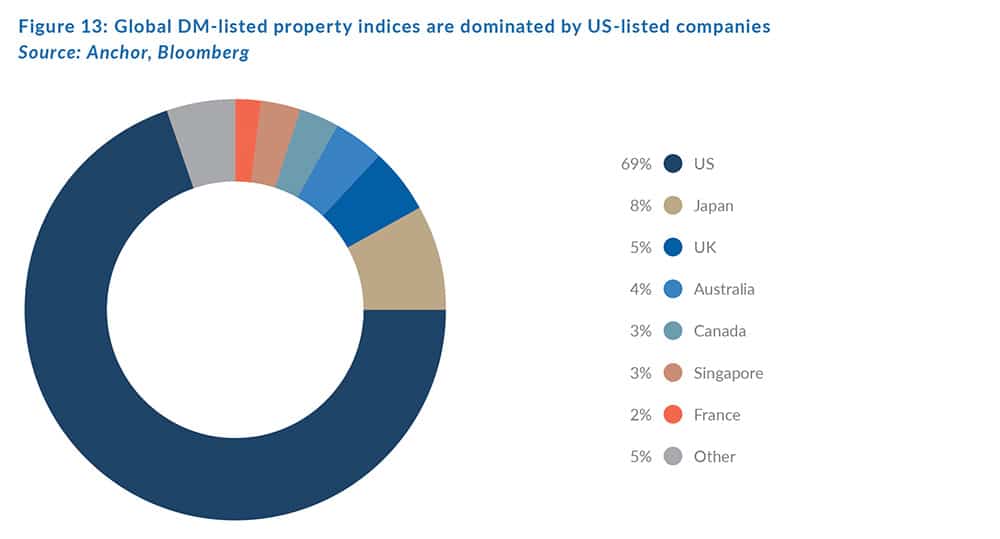
So, in terms of assessing the health of the global listed property market, the US is the country which we focus on most. The shape of the listed property market has also been shifting over the last few years, as retail and office REITs, which in the past dominated investment opportunities, are increasingly having to compete with industrial and specialised REITs for investors’ capital.
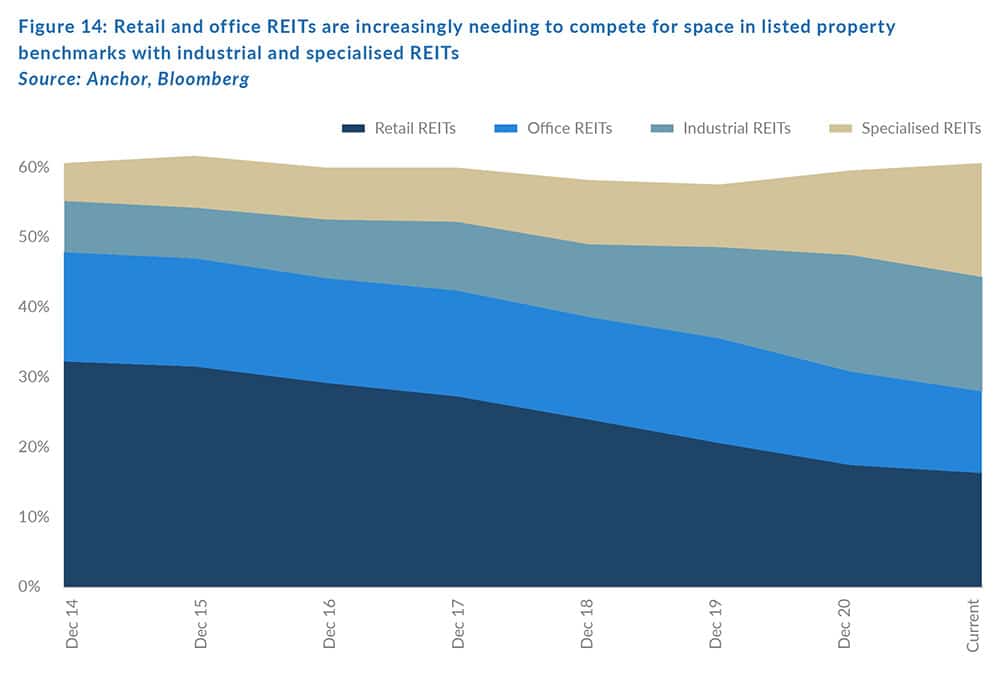
The industrial and specialised REIT sectors generally service the online economy, with most of the industrial REIT sector focussed on warehousing and logistics, which obviously forms a key part of the eCommerce supply chain. Specialised REITs can broadly be divided into two categories:
- Data centres – which store data associated with online activity and help facilitate online connectivity; and
- Storage facilities – these are generally warehouses, where people store the stuff they cannot fit into their homes.
Industrial and specialised REITs provide some of the lowest yields within the listed real estate market, with the attraction instead being their ability to grow along with higher demand.
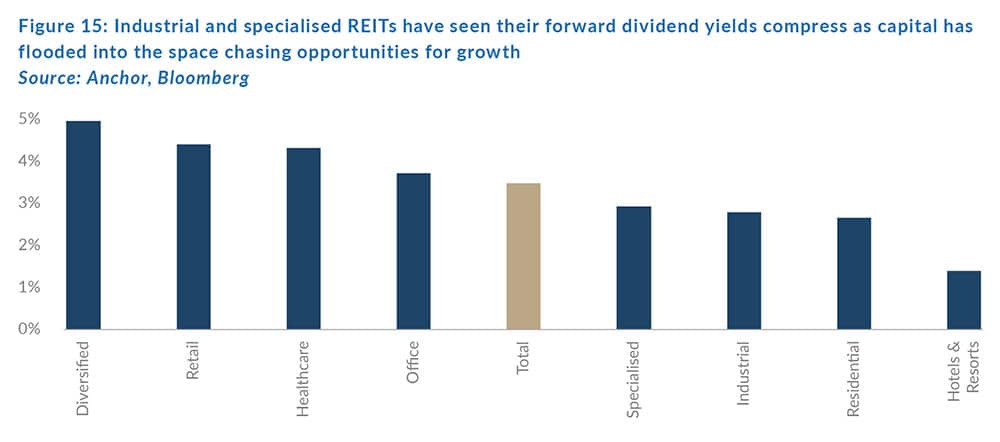
That leaves investors in a tricky situation – they can achieve higher yields in the old economy, office and retail sectors, perhaps hoping that the structural headwinds are largely behind those sectors and income will stop shrinking. Alternatively, they can take less attractive yields in the specialised and industrial segments that have benefitted from structural growth opportunities linked to the online economy and hope that those trends have further to run and that capital flooding into the space will not create a supply overhang. Our view is that neither the old economy opportunities in retail and office, nor the new economy opportunities in specialised and industrial are overwhelmingly compelling.
We believe it is likely that we will see the short-term performance in these sectors pushed along by the same short-term themes driving markets more broadly i.e., as the prospect of higher rates and normalising mobility (“reopening trade”) come to the fore it is likely to be supportive of the old economy sectors and vice versa for the new economy sectors. In general, the listed property sector, much like most other asset classes, is fully priced at the asset class level and opportunities for outperformance are most likely to come from individual companies that can execute the strategy better than their peers.
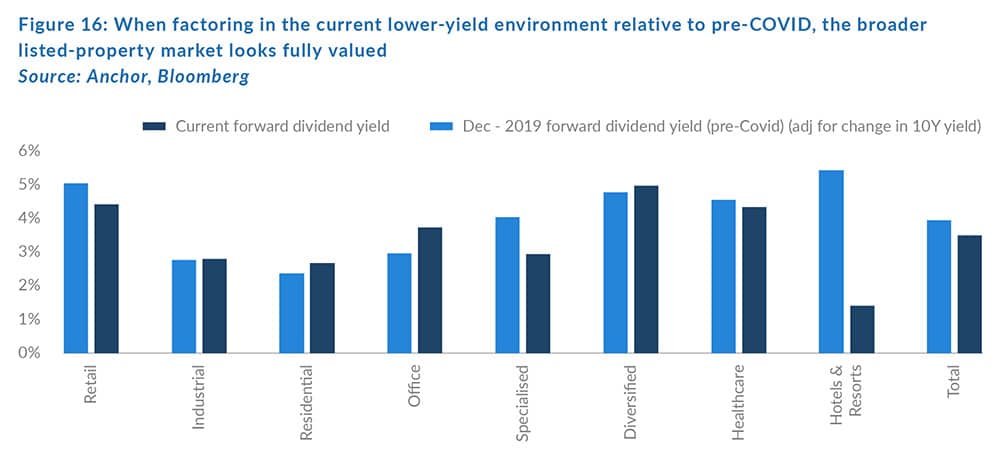
In conclusion, we expect a lot of the sector-level activity to net itself out and investors are likely to achieve a mid-single-digit US dollar return in the sector over the course of the next twelve months with c. two-thirds of that return in the form of dividend income.